
Постоянная
систематическая погрешность может быть
найдена методами совместной обработки
результатов измерений.Действительно,результат
одного измерения можно представить в
виде,если xi=xист+
+ϴi
,где
ϴi=сonst=ϴ,то
при усреднении результатов:
Xcр=xист+
Построеная
систематическая погрешность не
устраняется при многократных измерениях.
Для ее устранения применяют следующие
методы:
1)метод
замещения(корда сравнение осуществляется
заменой измеряемой величины известной
величиной так,что в состоянии и действии
всех используемых средств измерений
не происходит изменений.Взвешивание
по методу Борда позволяет исключить из
метода систематическую погрешность
из-за неравноплечести весов.Эксперемент
заключается в следующем:На одну чашу
помещают определенную массу,весы
уравновешивают наложением на другую
чашу негигроскопического,неиспаряющегося
груза,определяемую массу снимают,на ее
место ставят гири до достижения
равновесия.Суммарная маса гирь для
восстановления равновесия соответствует
значению определяемой массы.
2)метод
противопоставления(измерения повторяються
дважды и проводяться так,чтобы причина
посторонней систематической погрешности
оказывала противоположное воздействие
на результат)Пример:взвешивание по
методу Гауса для исключения из результата
измерений систематической погрешности
от неравноплечести весов.сущность
эксперемента:При первом взвешивании
массу X,помещенную на одну чашу весов
,уравновешивают гирями общей массой
m1.
X=; -действительное отклонение плеч
весов.Затем гири и массу X меняют
местами,т.к .Для его восстановления
придерся использовать гири массой m2
и будет выполняться равенство m2=.Для
нахождения x разделим первое уравнение
на 2-е: x=
3)метод
компенсации погрешности по знаку
(предусматривают 2 измерения,выполненных
так,чтобы постоянная систематическая
погрешность входила в результаты с
противоположными знаками.Пример:для
устранения влияния на результаты
измерения магнитного поля Земли.первое
измерение производят при произвольном
расположении прибора,второе-развернув
его на 1800
4)метод
рандомизации-наиболее универсальный
способ ,состоящий в том, что одна и таже
величина измеряется разными
методами,приборами, систематические
погрешности каждого из них для всей
совокупности-разные СВ.Поэтому при
увеличении числа используемых
методов,приборов систематической
погрешности взаимокомпенсируется при
усреднении результататов.
15. Методы обнаружения и устранения переменных систематических погрешностей из результатов измерений (анализ знаков, графический метод, метод симметричных наблюдений).
Для
обнаружения и устранения переменной
систематической погрешности применяют
следующие приемы и методы:
1.Анализ
знаков погрешности.
Если последовательность знаков (группа
знаков) + сменяется последовательностью
знаков –
или на оборот, то присутствует монотонно
изменяющаяся систематическая погрешность
(прогрессивная).
Если
группы знаков + и – чередуются, то
присутствует периодическая систематическая
погрешность.
2.Графический
метод.
Заключается в построении графика
последовательно не исправленных
результатов измерений. На графике через
полученные точки проводят плавную
кривую, которая отражает тенденцию
результата измерения, если она существует.
Если тенденция не прослеживается,
считают, что переменная систематическая
погрешность практически отсутствует.
3.Метод
симметричных наблюдений. Применяется
для исключительно прогрессивной
погрешности, изменяется по линейному
закону. Заключается в том, что измерения
выполняют последовательно через
одинаковые интервалы времени, при
обработке используют свойства любых
2-х результатов симметричных относительно
средней точки интервала наблюдений:
Погрешность результатов любой пары
симметричных наблюдений при усреднении
оказывается равный погрешности,
соответствующей средней точки интервала.
Например:
Взвешивание по способу Барда, когда
первоначальная неравноплечесть
прогрессивно возрастает. Проводят 4-е
измерения: 1) массу х уравновешивают
массой z в момент времени τ1:
х=(l2/l1+τ1)z,
где
l1/l2
– отношение плеч весов, когда на них не
действует причина вызывающая прогрессивную
погрешность. 2) снимают массу х и в момент
времени τ2
уравновешивают
массу z гирями общей массой m1:
m1=(l2/l1+τ2)z.
3) в
момент времени τ3
производят
повторное уравновешивание, для чего
используют гири массой m2:
m2=(l2/l1+τ3)z.
4) в
момент времени τ4,
гири
m2
снимают и кладут на чашу массу х, т.к.
неравноплечесть изменилась, к моменту
τ4,
для
получения равновесия, на одну из чаш
приходится добавить гири массой m:
х±m=(l2/l1+τ4)z.
Знак
плюс свидетельствует о том, что масса
m добавлена к х, а знак минус – к z.
Среднее
из результатов 1-го и 4-го взвешивания
равно х±m/2=(l2/l1+(τ1+
τ4)/2)z
(*). Для
2-го и 3-го взвешивания среднее равно
(m1+m2)/2=(l2/l1+(τ2+
τ3)/2)z
(**). Т.к.
среднее значение погрешности результатов
пар симметричных наблюдений равны между
собой, то (τ1+
τ4)/2=(τ2+
τ3)/2,
тогда
правые части равенств * и ** равны, а
значит равны их левые части. Отсюда
нашли нужную массу х=(m1+m2±m)/2.
В
результате обработки данных исключением
оказалась не только прогрессивная
погрешность обусловленная изменением
неравноплечести, но и постоянная
систематическая погрешность от
неравноплечести весов.
4. Специальные
статистические
методы.
К ним относится способ последовательных
разновидностей (критерий Аббе,
дисперсионный анализ и др.).
Соседние файлы в предмете [НЕСОРТИРОВАННОЕ]
- #
- #
- #
- #
- #
- #
- #
- #
- #
- #
- #
Если вы устраняете систематическую ошибку модели, то уже слишком поздно
Время прочтения
7 мин
Просмотры 5.4K

Введение
Машинное обучение — это технологический прорыв, случающийся раз в поколение. Однако с ростом его популярности основной проблемой становятся систематические ошибки алгоритма. Если модели ML не обучаются на репрезентативных данных, у них могут развиться серьёзные систематические ошибки, оказывающие существенный вред недостаточно представленным группам и приводящие к созданию неэффективных продуктов. Мы изучили массив данных CoNLL-2003, являющийся стандартом для создания алгоритмов распознавания именованных сущностей в тексте, и выяснили, что в данных присутствует серьёзный перекос в сторону мужских имён. При помощи наших технологии мы смогли компенсировать эту систематическую ошибку:
- Мы обогатили данные, чтобы выявить сокрытые систематические ошибки
- Дополнили массив данных недостаточно представленными примерами, чтобы компенсировать гендерный перекос
Модель, обученная на нашем расширенном массиве данных CoNLL-2003, характеризуется снижением систематической ошибки и повышенной точностью, и это показывает, что систематическую ошибку можно устранить без каких-либо изменений в модели. Мы выложили в open source наши аннотации Named Entity Recognition для исходного массива данных CoNLL-2003, а также его улучшенную версию, скачать их можно здесь.
Систематическая ошибка алгоритма: слабое место ИИ
Сегодня тысячи инженеров и исследователей создают системы, самостоятельно обучающиеся тому, как достигать существенных прорывов — повышать безопасность на дорогах при помощи беспилотных автомобилей, лечить болезни оптимизированными ИИ процедурами, бороться с изменением климата при помощи управления энергопотреблением.
Однако сила самообучающихся систем является и их слабостью. Так как фундаментом всех процессов машинного обучения являются данные, обучение на несовершенных данных может привести к искажённым результатам.
ИИ-системы имеют большие полномочия, поэтому они могут наносить существенный ущерб. Недавние протесты против полицейской жестокости, приведшей к смертям Джорджа Флойда, Бреонны Тейлор, Филандо Кастиле, Сандры Блэнд и многих других, является важным напоминанием о систематическом неравенстве в нашем обществе, которое не должны усугублять ИИ-системы. Но нам известны многочисленные примеры (закрепляющие гендерные стереотипы результаты поиска картинок, дискриминация чёрных подсудимых в системах управления данными нарушителей и ошибочная идентификация цветных людей системами распознавания лиц), показывающие, что предстоит пройти долгий путь, прежде чем проблема систематических ошибок ИИ будет решена.
Распространённость ошибок вызвана лёгкостью их внесения. Например, они проникают в «золотые стандарты» моделей и массивов данных в open source, ставшие фундаментом огромного объёма работы в сфере ML. Массив данных для определения эмоционального настроя текста word2vec, используемый в построении моделей других языков, искажён по этнической принадлежности, а word embeddings — способ сопоставления слов и значений алгоритмом ML — содержит сильно искажённые допущения о занятиях, с которыми ассоциируются женщины.
Проблема (и, как минимум, часть её решения) лежит в данных. Чтобы проиллюстрировать это, мы провели эксперимент с одним из самых популярных массивов данных для построения систем распознавания именованных сущностей в тексте: CoNLL-2003.
Что такое «распознавание именованных сущностей»?
Распознавание именованных сущностей (Named-Entity Recognition, NER) — один из фундаментальных камней моделей естественных языков, без него были бы невозможны онлайн-поиск, извлечение информации и анализ эмоционального настроя текста.
Миссия нашей компании заключается в ускорении разработки ИИ. Естественный язык — одна из основных сфер наших интересов. Наш продукт Scale Text содержит NER, заключающееся в аннотировании текста согласно заданному списку меток. На практике, среди прочего, это может помочь крупным розничным сетям анализировать онлайн-обсуждение их продуктов.
Многие модели NER обучаются и подвергаются бенчмаркам на CoNLL-2003 — массиве данных из примерно 20 тысяч предложений новостных статей Reuters, аннотированных такими атрибутами, как «PERSON», «LOCATION» и «ORGANIZATION».
Нам захотелось изучить эти данные на наличие систематических ошибок. Для этого мы воспользовались своим конвейером разметки, чтобы категоризировать все имена в массиве данных, размечая их как мужские, женские или гендерно-нейтральные, исходя из традиционного использования имён.
При этом мы выявили существенную разницу. Мужские имена упоминались почти в пять раз чаще женских, и менее 2% имён были гендерно-нейтральными:

Это вызвано тем, что по социальным причинам новостные статьи в основном содержат мужские имена. Однако из-за этого модель NER, обученная на таких данных, лучше будет справляться с выбором мужских имён, чем женских. Например, поисковые движки используют модели NER для классификации имён в поисковых запросах, чтобы выдавать более точные результаты. Но если внедрить модель NER с перекосом, то поисковый движок хуже будет идентифицировать женские имена по сравнению с мужскими, и именно подобная малозаметная распространённая систематическая ошибка может проникнуть во многие системы реального мира.
Новый эксперимент по снижению систематической ошибки
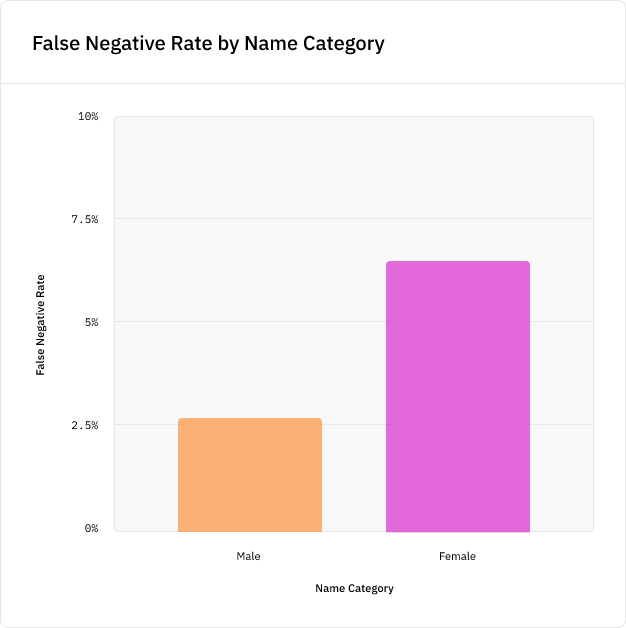
Чтобы проиллюстрировать это, мы обучили модель NER для изучения того, как этот гендерный перекос повлияет на её точность. Был создан алгоритм извлечения имён, выбирающий метки PERSON при помощи популярной NLP-библиотеки spaCy, и на подмножестве данных CoNLL была обучена модель. Затем мы протестировали модель на новых именах из тестовых данных, не присутствовавших в данных обучения, и обнаружили, что модель с вероятностью на 5% больше пропустит новое женское имя, чем новое мужское имя, а это серьёзное расхождение в точности:
Мы наблюдали схожие результаты, когда применили модель к шаблону «NAME is a person», подставив 100 самых популярных мужских и женских имён на каждый год переписи населения США. Результаты работы модели оказались значительно хуже для женских имён во все года переписи:
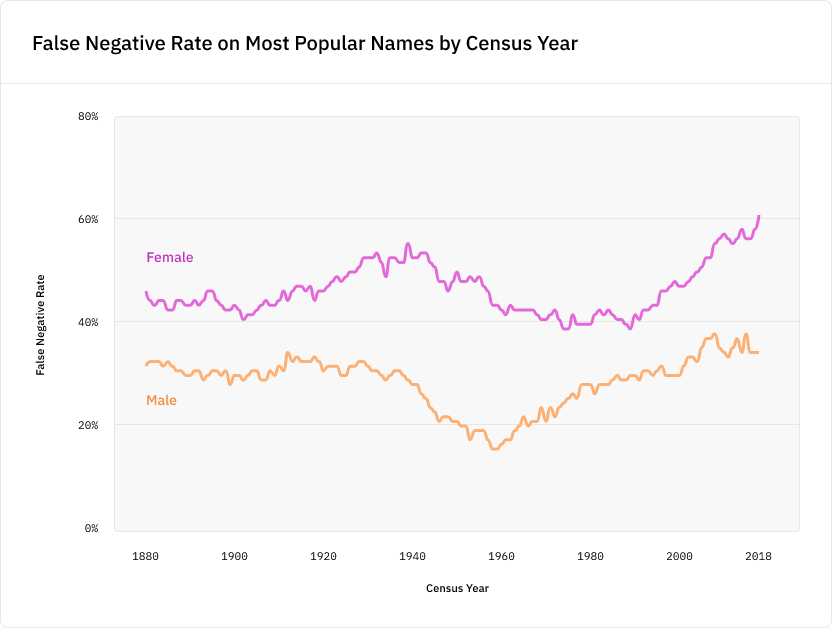
Критически важно то, что наличие перекоса в данных обучения приводит к смещению ошибок в сторону недостаточно представленных категорий. Эксперимент с переписями демонстрирует это и другим образом: точность модели существенно деградирует после 1997 года (точки отсечения статей Reuters в массиве данных CoNLL), потому что массив данных больше не является репрезентативным отображением популярности имён каждого последующего года.
Модели обучаются соответствовать трендам данных, на которых они обучены. Нельзя ожидать их хорошей точности в случаях, когда они видели лишь малое количество примеров.
Если вы исправляете систематическую ошибку модели, то уже слишком поздно
Как же это исправить?
Один из способов — попробовать устранить систематическую ошибку модели, например, выполнив постобработку модели или добавив целевую функцию для смягчения перекоса, оставив определение подробностей самой модели.
Но это не лучший подход по множеству причин:
- Справедливость — это очень сложная проблема, и мы не можем ждать, что алгоритм решит её сам. Исследование показало, что обучение алгоритма на одинаковый уровень точности для всех подмножеств населения не обеспечит справедливости и нанесёт вред обучению модели.
- Добавление новых целевых функций может навредить точности модели, приводя к негативному побочному эффекту. Вместо этого лучше обеспечить простоту алгоритма и сбалансированность данных, что повысит точность модели и позволит избежать негативных эффектов.
- Неразумно ожидать, что модель покажет хорошие результаты в случаях, примеров которых она видела очень мало. Наилучший способ обеспечения хороших результатов заключается в повышении разнообразия данных.
- Попытки устранения систематической ошибки при помощи инженерных техник — это дорогой и длительный процесс. Гораздо дешевле и проще изначально обучать модели на данных без перекосов, освободив ресурсы инженеров для работы над реализацией.
Данные — это лишь одна часть проблемы систематических ошибок. Однако эта часть фундаментальна и влияет на всё, что идёт после неё. Именно поэтому мы считаем, что данные содержат ключ к частичному решению, обеспечивая потенциальные систематические улучшения в исходных материалах. Если вы не размечаете критические классы (например, гендер или этническую принадлежность) явным образом, то невозможно сделать так, чтобы эти классы не были источником систематической ошибки.
Такая ситуация контринтуитивна. Кажется, что если нам нужно построить модель, не зависящую от чувствительных характеристик наподобие гендера, возраста или этнической принадлежности, то лучше исключить эти свойства из данных обучения, чтобы модель не могла их учитывать.
Однако принцип «справедливости, реализуемой через неведение» на самом деле усугубляет проблему. Модели ML превосходно справляются с выводом заключений из признаков, они не прекращают делать этого, если мы не разметили эти признаки явным образом. Систематические ошибки просто остаются невыявленными, из-за чего их сложнее устранить.
Единственный надёжный способ решения проблемы заключается в разметке большего количества данных, чтобы сбалансировать распределение имён. Мы использовали отдельную модель ML для идентификации предложений в корпусах Reuters и Brown, с большой вероятностью содержащих женские имена, а затем разметили эти предложения в нашем конвейере NER, чтобы дополнить CoNLL.
Получившийся массив данных, который мы назвали CoNLL-Balanced, содержит на 400 с лишним больше женских имён. После повторного обучения на нём модели NER мы обнаружили, что алгоритм больше не имеет систематической ошибки, приводящей к снижению показателей при распознавании женских имён:

Кроме того, модель улучшила показатели и при распознавании мужских имён.
Это стало впечатляющей демонстрацией важности данных. Благодаря устранению перекоса в исходном материале нам не пришлось вносить никаких изменений в нашу модель ML, что позволило сэкономить на времени разработки. И мы достигли этого без негативного влияния на точность модели; на самом деле, она даже слегка увеличилась.
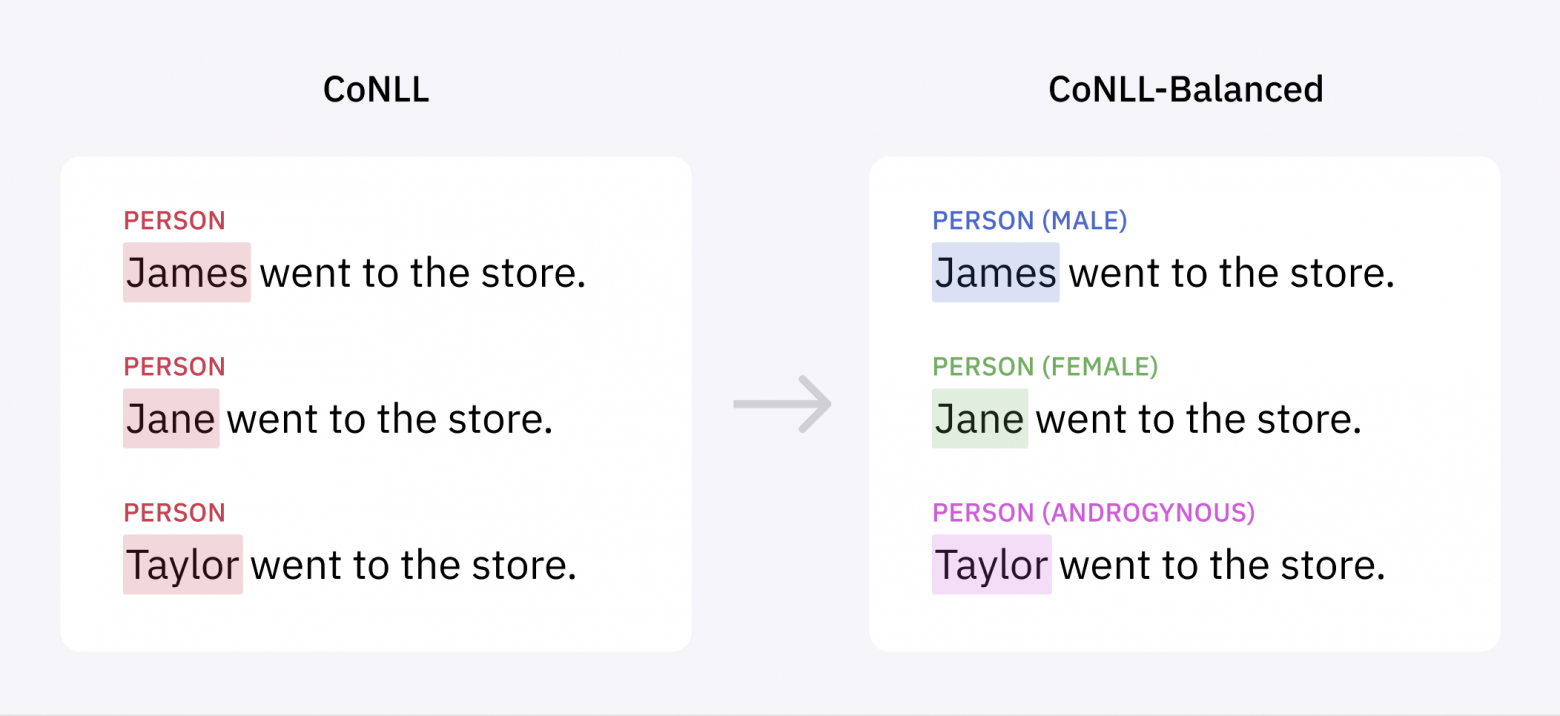
Чтобы позволить сообществу разработчиков развивать нашу работу и устранять гендерный перекос в моделях, построенных на основе CoNLL-2003, мы выложили на наш веб-сайте дополненный массив данных в open source, в том числе и добавив гендерную информацию.
Сообщество разработчиков ИИ/ML имеет проблемы с культурными различиями, но мы испытываем умеренный оптимизм от этих результатов. Они намекают на то, что мы, возможно, сможем предложить техническое решение насущной социальной проблемы, если займёмся проблемой сразу же, выявим сокрытые систематические ошибки и улучшим точность модели для всех.
Сейчас мы изучаем, как этот подход можно применить к ещё одному критичному атрибуту — этнической принадлежности — чтобы придумать, как создать надёжную систему для устранения перекоса в массивах данных, распространяющегося и на другие охраняемые от дискриминации категории населения.
Кроме того, это показывает, почему наша компания уделяет так много внимания качеству данных. Если нельзя доказать, что данные точны, сбалансированы и лишены систематических ошибок, то нет гарантии того, что создаваемые на их основе модели будут безопасными и точными. А без этого мы не сможем создавать качественно новых ИИ-технологий, идущих на пользу всем людям.
Благодарности
Упоминаемый в этом посте массив данных CoNLL 2003 — это тестовый набор Reuters-21578, Distribution 1.0, доступный для скачивания на странице проекта исходного эксперимента 2003 года: https://www.clips.uantwerpen.be/conll2003/ner/.
Для учёта и устранения систематических погрешностей применяют методы, которые условно можно разбить на две группы: теоретические и экспериментальные способы.
1. Теоретические способы возможны, когда может быть получено аналитическое выражение для искомой погрешности на основании априорной информации.
2. Экспериментальные способы также предполагают наличие априорной информации, но лишь качественного характера. Для получения количественной оценки необходимо проведение дополнительных исследований.
Для устранения систематических погрешностей применяются следующие методы:
1. Постоянные систематические погрешности.
а) Метод замещения — осуществляется путем замены измеряемой величины известной величиной так, чтобы в состоянии и действии средства измерений не происходило изменений;
б) Метод противопоставления.
Измерения выполняются с двумя наблюдениями, проводимыми так, чтобы причина постоянной погрешности оказывала разные, но известные по закономерности воздействия на результаты наблюдений.
в) Метод компенсации погрешности по знаку.
Измерения также проводятся дважды так, чтобы постоянная систематическая погрешность входила в результат измерения с разными знаками. За результат измерения принимается среднее значение двух измерений.
2. Прогрессирующие систематические погрешности.
а) Метод симметричных наблюдений.
Измерения производят с несколькими наблюдениями, проводимыми через равные интервалы времени, затем обрабатывают результаты, вычисляют среднее арифметическое симметрично расположенных наблюдений. Теоретически эти средние значения должны быть равны. Эти данные позволяют контролировать ход эксперимента, а также устранять систематические погрешности.
б) Метод рандомизации.
Этот метод основан на переводе систематических погрешностей в случайные. При этом измерение некоторой физической величины проводят рядом однотипных приборов с дальнейшей статистической обработкой полученных результатов. Уменьшение систематической погрешности достигается и при изменении случайным образом методики и условий проведения измерений. При определёнии значений систематической погрешности, результаты измерений исправляют, то есть вносят либо поправку, или поправочный множитель, но исправленные результаты обязательно содержат не исключенные остатки систематических погрешностей (НСП)
From Wikipedia, the free encyclopedia
«Systematic bias» redirects here. For the sociological and organizational phenomenon, see Systemic bias.
Observational error (or measurement error) is the difference between a measured value of a quantity and its true value.[1] In statistics, an error is not necessarily a «mistake». Variability is an inherent part of the results of measurements and of the measurement process.
Measurement errors can be divided into two components: random and systematic.[2]
Random errors are errors in measurement that lead to measurable values being inconsistent when repeated measurements of a constant attribute or quantity are taken. Systematic errors are errors that are not determined by chance but are introduced by repeatable processes inherent to the system.[3] Systematic error may also refer to an error with a non-zero mean, the effect of which is not reduced when observations are averaged.[citation needed]
Measurement errors can be summarized in terms of accuracy and precision.
Measurement error should not be confused with measurement uncertainty.
Science and experiments[edit]
When either randomness or uncertainty modeled by probability theory is attributed to such errors, they are «errors» in the sense in which that term is used in statistics; see errors and residuals in statistics.
Every time we repeat a measurement with a sensitive instrument, we obtain slightly different results. The common statistical model used is that the error has two additive parts:
- Systematic error which always occurs, with the same value, when we use the instrument in the same way and in the same case.
- Random error which may vary from observation to another.
Systematic error is sometimes called statistical bias. It may often be reduced with standardized procedures. Part of the learning process in the various sciences is learning how to use standard instruments and protocols so as to minimize systematic error.
Random error (or random variation) is due to factors that cannot or will not be controlled. One possible reason to forgo controlling for these random errors is that it may be too expensive to control them each time the experiment is conducted or the measurements are made. Other reasons may be that whatever we are trying to measure is changing in time (see dynamic models), or is fundamentally probabilistic (as is the case in quantum mechanics — see Measurement in quantum mechanics). Random error often occurs when instruments are pushed to the extremes of their operating limits. For example, it is common for digital balances to exhibit random error in their least significant digit. Three measurements of a single object might read something like 0.9111g, 0.9110g, and 0.9112g.
Characterization[edit]
Measurement errors can be divided into two components: random error and systematic error.[2]
Random error is always present in a measurement. It is caused by inherently unpredictable fluctuations in the readings of a measurement apparatus or in the experimenter’s interpretation of the instrumental reading. Random errors show up as different results for ostensibly the same repeated measurement. They can be estimated by comparing multiple measurements and reduced by averaging multiple measurements.
Systematic error is predictable and typically constant or proportional to the true value. If the cause of the systematic error can be identified, then it usually can be eliminated. Systematic errors are caused by imperfect calibration of measurement instruments or imperfect methods of observation, or interference of the environment with the measurement process, and always affect the results of an experiment in a predictable direction. Incorrect zeroing of an instrument leading to a zero error is an example of systematic error in instrumentation.
The Performance Test Standard PTC 19.1-2005 “Test Uncertainty”, published by the American Society of Mechanical Engineers (ASME), discusses systematic and random errors in considerable detail. In fact, it conceptualizes its basic uncertainty categories in these terms.
Random error can be caused by unpredictable fluctuations in the readings of a measurement apparatus, or in the experimenter’s interpretation of the instrumental reading; these fluctuations may be in part due to interference of the environment with the measurement process. The concept of random error is closely related to the concept of precision. The higher the precision of a measurement instrument, the smaller the variability (standard deviation) of the fluctuations in its readings.
Sources[edit]
Sources of systematic error[edit]
Imperfect calibration[edit]
Sources of systematic error may be imperfect calibration of measurement instruments (zero error), changes in the environment which interfere with the measurement process and sometimes imperfect methods of observation can be either zero error or percentage error. If you consider an experimenter taking a reading of the time period of a pendulum swinging past a fiducial marker: If their stop-watch or timer starts with 1 second on the clock then all of their results will be off by 1 second (zero error). If the experimenter repeats this experiment twenty times (starting at 1 second each time), then there will be a percentage error in the calculated average of their results; the final result will be slightly larger than the true period.
Distance measured by radar will be systematically overestimated if the slight slowing down of the waves in air is not accounted for. Incorrect zeroing of an instrument leading to a zero error is an example of systematic error in instrumentation.
Systematic errors may also be present in the result of an estimate based upon a mathematical model or physical law. For instance, the estimated oscillation frequency of a pendulum will be systematically in error if slight movement of the support is not accounted for.
Quantity[edit]
Systematic errors can be either constant, or related (e.g. proportional or a percentage) to the actual value of the measured quantity, or even to the value of a different quantity (the reading of a ruler can be affected by environmental temperature). When it is constant, it is simply due to incorrect zeroing of the instrument. When it is not constant, it can change its sign. For instance, if a thermometer is affected by a proportional systematic error equal to 2% of the actual temperature, and the actual temperature is 200°, 0°, or −100°, the measured temperature will be 204° (systematic error = +4°), 0° (null systematic error) or −102° (systematic error = −2°), respectively. Thus the temperature will be overestimated when it will be above zero and underestimated when it will be below zero.
Drift[edit]
Systematic errors which change during an experiment (drift) are easier to detect. Measurements indicate trends with time rather than varying randomly about a mean. Drift is evident if a measurement of a constant quantity is repeated several times and the measurements drift one way during the experiment. If the next measurement is higher than the previous measurement as may occur if an instrument becomes warmer during the experiment then the measured quantity is variable and it is possible to detect a drift by checking the zero reading during the experiment as well as at the start of the experiment (indeed, the zero reading is a measurement of a constant quantity). If the zero reading is consistently above or below zero, a systematic error is present. If this cannot be eliminated, potentially by resetting the instrument immediately before the experiment then it needs to be allowed by subtracting its (possibly time-varying) value from the readings, and by taking it into account while assessing the accuracy of the measurement.
If no pattern in a series of repeated measurements is evident, the presence of fixed systematic errors can only be found if the measurements are checked, either by measuring a known quantity or by comparing the readings with readings made using a different apparatus, known to be more accurate. For example, if you think of the timing of a pendulum using an accurate stopwatch several times you are given readings randomly distributed about the mean. Hopings systematic error is present if the stopwatch is checked against the ‘speaking clock’ of the telephone system and found to be running slow or fast. Clearly, the pendulum timings need to be corrected according to how fast or slow the stopwatch was found to be running.
Measuring instruments such as ammeters and voltmeters need to be checked periodically against known standards.
Systematic errors can also be detected by measuring already known quantities. For example, a spectrometer fitted with a diffraction grating may be checked by using it to measure the wavelength of the D-lines of the sodium electromagnetic spectrum which are at 600 nm and 589.6 nm. The measurements may be used to determine the number of lines per millimetre of the diffraction grating, which can then be used to measure the wavelength of any other spectral line.
Constant systematic errors are very difficult to deal with as their effects are only observable if they can be removed. Such errors cannot be removed by repeating measurements or averaging large numbers of results. A common method to remove systematic error is through calibration of the measurement instrument.
Sources of random error[edit]
The random or stochastic error in a measurement is the error that is random from one measurement to the next. Stochastic errors tend to be normally distributed when the stochastic error is the sum of many independent random errors because of the central limit theorem. Stochastic errors added to a regression equation account for the variation in Y that cannot be explained by the included Xs.
Surveys[edit]
The term «observational error» is also sometimes used to refer to response errors and some other types of non-sampling error.[1] In survey-type situations, these errors can be mistakes in the collection of data, including both the incorrect recording of a response and the correct recording of a respondent’s inaccurate response. These sources of non-sampling error are discussed in Salant and Dillman (1994) and Bland and Altman (1996).[4][5]
These errors can be random or systematic. Random errors are caused by unintended mistakes by respondents, interviewers and/or coders. Systematic error can occur if there is a systematic reaction of the respondents to the method used to formulate the survey question. Thus, the exact formulation of a survey question is crucial, since it affects the level of measurement error.[6] Different tools are available for the researchers to help them decide about this exact formulation of their questions, for instance estimating the quality of a question using MTMM experiments. This information about the quality can also be used in order to correct for measurement error.[7][8]
Effect on regression analysis[edit]
If the dependent variable in a regression is measured with error, regression analysis and associated hypothesis testing are unaffected, except that the R2 will be lower than it would be with perfect measurement.
However, if one or more independent variables is measured with error, then the regression coefficients and standard hypothesis tests are invalid.[9]: p. 187 This is known as attenuation bias.[10]
See also[edit]
- Bias (statistics)
- Cognitive bias
- Correction for measurement error (for Pearson correlations)
- Errors and residuals in statistics
- Error
- Replication (statistics)
- Statistical theory
- Metrology
- Regression dilution
- Test method
- Propagation of uncertainty
- Instrument error
- Measurement uncertainty
- Errors-in-variables models
- Systemic bias
References[edit]
- ^ a b Dodge, Y. (2003) The Oxford Dictionary of Statistical Terms, OUP. ISBN 978-0-19-920613-1
- ^ a b John Robert Taylor (1999). An Introduction to Error Analysis: The Study of Uncertainties in Physical Measurements. University Science Books. p. 94, §4.1. ISBN 978-0-935702-75-0.
- ^ «Systematic error». Merriam-webster.com. Retrieved 2016-09-10.
- ^ Salant, P.; Dillman, D. A. (1994). How to conduct your survey. New York: John Wiley & Sons. ISBN 0-471-01273-4.
- ^ Bland, J. Martin; Altman, Douglas G. (1996). «Statistics Notes: Measurement Error». BMJ. 313 (7059): 744. doi:10.1136/bmj.313.7059.744. PMC 2352101. PMID 8819450.
- ^ Saris, W. E.; Gallhofer, I. N. (2014). Design, Evaluation and Analysis of Questionnaires for Survey Research (Second ed.). Hoboken: Wiley. ISBN 978-1-118-63461-5.
- ^ DeCastellarnau, A. and Saris, W. E. (2014). A simple procedure to correct for measurement errors in survey research. European Social Survey Education Net (ESS EduNet). Available at: http://essedunet.nsd.uib.no/cms/topics/measurement Archived 2019-09-15 at the Wayback Machine
- ^ Saris, W. E.; Revilla, M. (2015). «Correction for measurement errors in survey research: necessary and possible» (PDF). Social Indicators Research. 127 (3): 1005–1020. doi:10.1007/s11205-015-1002-x. hdl:10230/28341. S2CID 146550566.
- ^ Hayashi, Fumio (2000). Econometrics. Princeton University Press. ISBN 978-0-691-01018-2.
- ^ Angrist, Joshua David; Pischke, Jörn-Steffen (2015). Mastering ‘metrics : the path from cause to effect. Princeton, New Jersey. p. 221. ISBN 978-0-691-15283-7. OCLC 877846199.
The bias generated by this sort of measurement error in regressors is called attenuation bias.
Further reading[edit]
- Cochran, W. G. (1968). «Errors of Measurement in Statistics». Technometrics. 10 (4): 637–666. doi:10.2307/1267450. JSTOR 1267450.
From Wikipedia, the free encyclopedia
«Systematic bias» redirects here. For the sociological and organizational phenomenon, see Systemic bias.
Observational error (or measurement error) is the difference between a measured value of a quantity and its true value.[1] In statistics, an error is not necessarily a «mistake». Variability is an inherent part of the results of measurements and of the measurement process.
Measurement errors can be divided into two components: random and systematic.[2]
Random errors are errors in measurement that lead to measurable values being inconsistent when repeated measurements of a constant attribute or quantity are taken. Systematic errors are errors that are not determined by chance but are introduced by repeatable processes inherent to the system.[3] Systematic error may also refer to an error with a non-zero mean, the effect of which is not reduced when observations are averaged.[citation needed]
Measurement errors can be summarized in terms of accuracy and precision.
Measurement error should not be confused with measurement uncertainty.
Science and experiments[edit]
When either randomness or uncertainty modeled by probability theory is attributed to such errors, they are «errors» in the sense in which that term is used in statistics; see errors and residuals in statistics.
Every time we repeat a measurement with a sensitive instrument, we obtain slightly different results. The common statistical model used is that the error has two additive parts:
- Systematic error which always occurs, with the same value, when we use the instrument in the same way and in the same case.
- Random error which may vary from observation to another.
Systematic error is sometimes called statistical bias. It may often be reduced with standardized procedures. Part of the learning process in the various sciences is learning how to use standard instruments and protocols so as to minimize systematic error.
Random error (or random variation) is due to factors that cannot or will not be controlled. One possible reason to forgo controlling for these random errors is that it may be too expensive to control them each time the experiment is conducted or the measurements are made. Other reasons may be that whatever we are trying to measure is changing in time (see dynamic models), or is fundamentally probabilistic (as is the case in quantum mechanics — see Measurement in quantum mechanics). Random error often occurs when instruments are pushed to the extremes of their operating limits. For example, it is common for digital balances to exhibit random error in their least significant digit. Three measurements of a single object might read something like 0.9111g, 0.9110g, and 0.9112g.
Characterization[edit]
Measurement errors can be divided into two components: random error and systematic error.[2]
Random error is always present in a measurement. It is caused by inherently unpredictable fluctuations in the readings of a measurement apparatus or in the experimenter’s interpretation of the instrumental reading. Random errors show up as different results for ostensibly the same repeated measurement. They can be estimated by comparing multiple measurements and reduced by averaging multiple measurements.
Systematic error is predictable and typically constant or proportional to the true value. If the cause of the systematic error can be identified, then it usually can be eliminated. Systematic errors are caused by imperfect calibration of measurement instruments or imperfect methods of observation, or interference of the environment with the measurement process, and always affect the results of an experiment in a predictable direction. Incorrect zeroing of an instrument leading to a zero error is an example of systematic error in instrumentation.
The Performance Test Standard PTC 19.1-2005 “Test Uncertainty”, published by the American Society of Mechanical Engineers (ASME), discusses systematic and random errors in considerable detail. In fact, it conceptualizes its basic uncertainty categories in these terms.
Random error can be caused by unpredictable fluctuations in the readings of a measurement apparatus, or in the experimenter’s interpretation of the instrumental reading; these fluctuations may be in part due to interference of the environment with the measurement process. The concept of random error is closely related to the concept of precision. The higher the precision of a measurement instrument, the smaller the variability (standard deviation) of the fluctuations in its readings.
Sources[edit]
Sources of systematic error[edit]
Imperfect calibration[edit]
Sources of systematic error may be imperfect calibration of measurement instruments (zero error), changes in the environment which interfere with the measurement process and sometimes imperfect methods of observation can be either zero error or percentage error. If you consider an experimenter taking a reading of the time period of a pendulum swinging past a fiducial marker: If their stop-watch or timer starts with 1 second on the clock then all of their results will be off by 1 second (zero error). If the experimenter repeats this experiment twenty times (starting at 1 second each time), then there will be a percentage error in the calculated average of their results; the final result will be slightly larger than the true period.
Distance measured by radar will be systematically overestimated if the slight slowing down of the waves in air is not accounted for. Incorrect zeroing of an instrument leading to a zero error is an example of systematic error in instrumentation.
Systematic errors may also be present in the result of an estimate based upon a mathematical model or physical law. For instance, the estimated oscillation frequency of a pendulum will be systematically in error if slight movement of the support is not accounted for.
Quantity[edit]
Systematic errors can be either constant, or related (e.g. proportional or a percentage) to the actual value of the measured quantity, or even to the value of a different quantity (the reading of a ruler can be affected by environmental temperature). When it is constant, it is simply due to incorrect zeroing of the instrument. When it is not constant, it can change its sign. For instance, if a thermometer is affected by a proportional systematic error equal to 2% of the actual temperature, and the actual temperature is 200°, 0°, or −100°, the measured temperature will be 204° (systematic error = +4°), 0° (null systematic error) or −102° (systematic error = −2°), respectively. Thus the temperature will be overestimated when it will be above zero and underestimated when it will be below zero.
Drift[edit]
Systematic errors which change during an experiment (drift) are easier to detect. Measurements indicate trends with time rather than varying randomly about a mean. Drift is evident if a measurement of a constant quantity is repeated several times and the measurements drift one way during the experiment. If the next measurement is higher than the previous measurement as may occur if an instrument becomes warmer during the experiment then the measured quantity is variable and it is possible to detect a drift by checking the zero reading during the experiment as well as at the start of the experiment (indeed, the zero reading is a measurement of a constant quantity). If the zero reading is consistently above or below zero, a systematic error is present. If this cannot be eliminated, potentially by resetting the instrument immediately before the experiment then it needs to be allowed by subtracting its (possibly time-varying) value from the readings, and by taking it into account while assessing the accuracy of the measurement.
If no pattern in a series of repeated measurements is evident, the presence of fixed systematic errors can only be found if the measurements are checked, either by measuring a known quantity or by comparing the readings with readings made using a different apparatus, known to be more accurate. For example, if you think of the timing of a pendulum using an accurate stopwatch several times you are given readings randomly distributed about the mean. Hopings systematic error is present if the stopwatch is checked against the ‘speaking clock’ of the telephone system and found to be running slow or fast. Clearly, the pendulum timings need to be corrected according to how fast or slow the stopwatch was found to be running.
Measuring instruments such as ammeters and voltmeters need to be checked periodically against known standards.
Systematic errors can also be detected by measuring already known quantities. For example, a spectrometer fitted with a diffraction grating may be checked by using it to measure the wavelength of the D-lines of the sodium electromagnetic spectrum which are at 600 nm and 589.6 nm. The measurements may be used to determine the number of lines per millimetre of the diffraction grating, which can then be used to measure the wavelength of any other spectral line.
Constant systematic errors are very difficult to deal with as their effects are only observable if they can be removed. Such errors cannot be removed by repeating measurements or averaging large numbers of results. A common method to remove systematic error is through calibration of the measurement instrument.
Sources of random error[edit]
The random or stochastic error in a measurement is the error that is random from one measurement to the next. Stochastic errors tend to be normally distributed when the stochastic error is the sum of many independent random errors because of the central limit theorem. Stochastic errors added to a regression equation account for the variation in Y that cannot be explained by the included Xs.
Surveys[edit]
The term «observational error» is also sometimes used to refer to response errors and some other types of non-sampling error.[1] In survey-type situations, these errors can be mistakes in the collection of data, including both the incorrect recording of a response and the correct recording of a respondent’s inaccurate response. These sources of non-sampling error are discussed in Salant and Dillman (1994) and Bland and Altman (1996).[4][5]
These errors can be random or systematic. Random errors are caused by unintended mistakes by respondents, interviewers and/or coders. Systematic error can occur if there is a systematic reaction of the respondents to the method used to formulate the survey question. Thus, the exact formulation of a survey question is crucial, since it affects the level of measurement error.[6] Different tools are available for the researchers to help them decide about this exact formulation of their questions, for instance estimating the quality of a question using MTMM experiments. This information about the quality can also be used in order to correct for measurement error.[7][8]
Effect on regression analysis[edit]
If the dependent variable in a regression is measured with error, regression analysis and associated hypothesis testing are unaffected, except that the R2 will be lower than it would be with perfect measurement.
However, if one or more independent variables is measured with error, then the regression coefficients and standard hypothesis tests are invalid.[9]: p. 187 This is known as attenuation bias.[10]
See also[edit]
- Bias (statistics)
- Cognitive bias
- Correction for measurement error (for Pearson correlations)
- Errors and residuals in statistics
- Error
- Replication (statistics)
- Statistical theory
- Metrology
- Regression dilution
- Test method
- Propagation of uncertainty
- Instrument error
- Measurement uncertainty
- Errors-in-variables models
- Systemic bias
References[edit]
- ^ a b Dodge, Y. (2003) The Oxford Dictionary of Statistical Terms, OUP. ISBN 978-0-19-920613-1
- ^ a b John Robert Taylor (1999). An Introduction to Error Analysis: The Study of Uncertainties in Physical Measurements. University Science Books. p. 94, §4.1. ISBN 978-0-935702-75-0.
- ^ «Systematic error». Merriam-webster.com. Retrieved 2016-09-10.
- ^ Salant, P.; Dillman, D. A. (1994). How to conduct your survey. New York: John Wiley & Sons. ISBN 0-471-01273-4.
- ^ Bland, J. Martin; Altman, Douglas G. (1996). «Statistics Notes: Measurement Error». BMJ. 313 (7059): 744. doi:10.1136/bmj.313.7059.744. PMC 2352101. PMID 8819450.
- ^ Saris, W. E.; Gallhofer, I. N. (2014). Design, Evaluation and Analysis of Questionnaires for Survey Research (Second ed.). Hoboken: Wiley. ISBN 978-1-118-63461-5.
- ^ DeCastellarnau, A. and Saris, W. E. (2014). A simple procedure to correct for measurement errors in survey research. European Social Survey Education Net (ESS EduNet). Available at: http://essedunet.nsd.uib.no/cms/topics/measurement Archived 2019-09-15 at the Wayback Machine
- ^ Saris, W. E.; Revilla, M. (2015). «Correction for measurement errors in survey research: necessary and possible» (PDF). Social Indicators Research. 127 (3): 1005–1020. doi:10.1007/s11205-015-1002-x. hdl:10230/28341. S2CID 146550566.
- ^ Hayashi, Fumio (2000). Econometrics. Princeton University Press. ISBN 978-0-691-01018-2.
- ^ Angrist, Joshua David; Pischke, Jörn-Steffen (2015). Mastering ‘metrics : the path from cause to effect. Princeton, New Jersey. p. 221. ISBN 978-0-691-15283-7. OCLC 877846199.
The bias generated by this sort of measurement error in regressors is called attenuation bias.
Further reading[edit]
- Cochran, W. G. (1968). «Errors of Measurement in Statistics». Technometrics. 10 (4): 637–666. doi:10.2307/1267450. JSTOR 1267450.