Вопросы, рассмотренные в материале:
- Что такое усталость металлов
- История термина
- Основные виды усталости металла
- Причины возникновения усталости металла
- Как определить усталость металла
- Меры повышения выносливости металла
Что такое усталость металлов
Понятие «усталость металла» скрывает за собой неравновесно-напряженное состояние, из-за которого в материале накапливаются отрицательные остаточные явления. Кроме того, металл оказывается неспособен сопротивляться разрушающей силе ниже его предела прочности.
Появление статической усталости объясняется непрерывным продолжительным воздействием на предмет статичной нагрузки, которая меньше предела прочности металла.
Динамическая нагрузка, например, удары, вибрация, является знакопеременной, то есть при ней сжатие постоянно сменяется растяжением. При подобных процессах усталость металла наступает в короткие сроки и может классифицироваться как одноцикловая, малоцикловая и многоцикловая.
- Одноцикловая усталость металла – простыми словами это его разрушение в результате перехода в неравновесно-нагруженное состояние. Нагрузка оказывается единожды и равна либо превышает предел прочности материала.
- Малоцикловая усталость металла возникает из-за неравновесно-нагруженного состояния, вызывающего разрушение металла под действием нагрузки, соответствующей или немного превышающей предельный уровень его прочности. Количество нагружаемых циклов не превосходит 10 000.
- Многоцикловая усталость металла также является неравновесно-нагруженным состоянием, результатом которого становится разрушение металла при соответствующей либо превышающей предел прочности нагрузке. Количество циклов превышает 10 000.
История термина
В процессе развития транспорта инженеры стремились увеличить скорость его движения, однако это привело к увеличению частоты крушений. Дело в том, что ломались вагонные и паровозные оси, коленчатые валы на пароходах.
Подобная картина складывалась и на предприятиях, ведь и там важно было добиться, чтобы оборудование функционировало быстрее. Станки ускоряли за счет увеличения количества оборотов двигателя, что вскоре вызывало поломку деталей.

Специалисты пытались обнаружить причины аварий, качество металла изучалось в лабораторных условиях, но ничего выяснить не удавалось. Проверки показывали, что размеры элементов рассчитаны верно, использовался качественный металл, а детали имели хороший запас прочности.
Со временем инженеры обратили внимание на тот факт, что обычно из строя выходят компоненты механизмов, испытывающие на себе повторную переменную нагрузку. Допустим, именно такому воздействию подвергается шток в паровой машине: он крепится к шатуну, а тот приводит в движение коленчатый вал. В паровозе принцип примерно тот же, только ведущее колесо вращается благодаря работе кривошипа.
Поршень перемещается в цилиндре, из-за чего шток меняет направление движения. Сначала он испытывает на себе осевое сжатие, а потом растяжение, сопровождающееся изменением нагрузки на данный элемент.
Никто не мог понять, по какой причине повторяющаяся переменная нагрузка разрушает деталь, ведь с постоянной нагрузкой аналогичной величины материал может долго справляться.
Чтобы описать данный процесс, решили использовать усталость металла на фоне переменной нагрузки. Проблема лишь в том, что такое объяснение не несет в себе никакой информации. Кроме того, оно далеко от сути явления, поскольку усталость мышцы, сопровождающаяся снижением ее способности к сокращению, имеет более сложную природу, далекую от поломки металлического элемента.
Понятие «усталость» сохранилось в технике до сих пор, хотя уже известно, почему металл быстро разрушается при переменной нагрузке. По аналогии было введено понятие «выносливость металлов»: чем дольше изделие не «устает», тем более «выносливым» считается металл.
Если материал подвержен усталости, важно сформировать новые пределы напряжений, отказаться от имеющихся справочных материалов, опыта, накопившегося за годы инженерной работы.
Необходимо было доказать связь между выносливостью и повторяющимися переменными нагрузками, причем проверить способность металла к физической усталости можно было только опытным путем.
Всю вторую половину XIX века вопросы усталости и текучести металлов оставались одними из наиболее актуальных для технических обществ. Специалисты рассуждали о том, как колебания воздействуют на детали оборудования, корпусы морских судов.
Имена многих исследователей данной темы сейчас остаются неизвестным, поскольку мало у кого была возможность публиковать результаты своих опытов. До наших дней дошла информация только о ряде ученых, которые занимались определением сути усталости металлов.
Например, В. Альберт, горный инженер из Германии, стремился понять, почему обрывались подъемные цепи. В то время бадьи и клети опускались в шахту при помощи цепей, которые перебрасывали через шкив и накручивали на барабан специальной машины. На барабане звенья претерпевали изгибающую нагрузку, а при раскручивании цепи изгиб уступал место растяжению. Во время подъема груза процесс повторялся в обратном порядке.
Инженер понял, что причина обрыва кроется в частой перемене изгибания элементов цепи, пока она наматывается на барабан и огибает шкив. Чтобы доказать свое предположение, В. Альберт проводил опыты, до ста тысяч раз подвергая образцы изгибу. Далее он осматривал цепи, чтобы найти на звеньях трещины, сформировавшиеся из-за переменной нагрузки.

Аналогичные опыты с железными брусками в 1950-х годах проводили английские капитаны Г. Джеймс и Д. Гальтон. Они создали машину, чтобы быстро нагружать брус и снимать с него нагрузку.
Эти эксперименты вдохновили английского инженера В. Ферберна на изучение выносливости массивных железных балок, используемых при строительстве мостов. В 1960-х годах он работал с балками по 6-7 метров, при помощи рычагов оказывая и убирая нагрузку. Данный процесс сопровождался прогибом и выпрямлением изделия, а несколько сотен тысяч перемен нагрузки вызывали образование трещины.
Названные опыты носили бессистемный характер и не были представлены в широких технических кругах. На тот момент было сложно сказать, правда ли существует явление усталости металла либо трещины появлялись по случайному стечению обстоятельств.
Систематические исследования проводил механик из Германии А. Велер, несмотря на то, что он был выпускником коммерческого училища и работал чертежником на паровозном заводе, потом машинистом.
В 1847 году он устроился в Управление прусских железных дорог. Данный период в истории железнодорожного сообщения ознаменовался частыми авариями: ломались вагонные оси, выходили из строя детали паровозов, поезда сходили с рельсов. Это были серьезные проблемы как для промышленников, так и для правительственного технадзора.
Требовалось понять причины аварий, поэтому создали специальную постоянную комиссию, куда А. Велер вошел в качестве эксперта, долгое время работавшего с паровозами. Он проводил испытания металлов в лаборатории, сам изобретал машины, позволявшие подвергать образцы переменным растяжению, изгибу, скручиванию. Интересно, что современные ученые испытывают материалы на изгиб на оборудовании, разработанном А. Велером.
Его машины для испытаний на усталость металла отличались небольшими скоростями, из-за чего исследования длились годами. Так, станок для имитации переменного изгиба совершал за минуту всего 72 оборота, а один из образцов выдержал более 132 миллионов перемен нагрузки.
Тем не менее А. Велер смог доказать, что образцы из стали и железа разрушаются при повторной переменной нагрузке, которая в иных ситуациях оказывается допустимой. Деталь сможет справляться с ней в течение неограниченного отрезка времени, если подобная нагрузка остается в определенных границах, то есть не выходит за предел выносливости. Данную величину необходимо учитывать при создании проектов быстроходных паровозов и скоростных машин.
Опыты А. Велера в корне изменили представления об уровне нагрузки, которой можно подвергать вагонные оси, шатуны, штоки цилиндров, пр. Благодаря ему расчеты компонентов скоростных машин начали выполнять в соответствии с пределом выносливости, который устанавливали опытным путем.
Основные виды усталости металла
- Пороговая усталость представляет собой состояние, при котором заметны первые признаки неравномерного напряжения, являющегося необратимым.
- Накопление усталости является необратимым относительным процессом накопления неравновесно-напряженного состояния, в результате которого металл разрушается.
Накопленная усталость может быть устранена посредством высокотемпературного отжига, то есть термической обработки, если данное состояние не является запредельным. Металлические элементы доводят до +650…+750 °C, час выдерживают, после чего не вынимают из печи, а медленно остужают прямо в ней – на данный процесс уходит до шести часов. Так в металле происходит рекристаллизация, при которой кристаллы со следами деформации исчезают, а на их месте образуются новые целые кристаллы.

Снова добиться прежней износостойкости, надежности конструкции, увеличить ее срок службы можно, если повысить уровень твердости. С этой целью прибегают к поверхностной или объемной закалке. Температуру металла повышают до +850 °C и выдерживают в течение 15–20 минут, затем резко охлаждают в воде или масле. В итоге обеспечивается высокая твердость детали.
- Предельно допустимая усталость металла проявляется как неравновесно-напряженное состояние, не провоцирующее разрушение. Вернуть изделию прежние свойства можно посредством термической обработки.
- Критическая усталость является неравновесно-напряженным состоянием, при котором материал не справляется с воздействием разрушающей силы, несмотря на то, что она гораздо меньше его предела прочности.
- Полная усталость представляет собой неравновесно-напряженное состояние, сопровождающееся разрушением материала без видимых причин либо под действием незначительной внешней силы. Металл с подобной степенью усталости подлежит переплавке, так как исправить положение посредством термообработки не получится.
- Частичная усталость считается неравновесно-напряженным состоянием, в котором материал может сопротивляться внутренним напряжениям, разрушающей силе, воздействующей на него извне. Повысить прочностные характеристики можно, прибегнув к термической обработке.
- Локальная усталость обозначает наличие негативных изменений на отдельных зонах изделия.
- Общая усталость проявляется на всей детали.
- Обратимая усталость представляет собой неравновесно-напряженное состояние, которое можно устранить либо снизить его степень посредством улучшающих обработок.
- Остаточная усталость обозначает частичное сохранение материалом напряжения после термической обработки.
Старение и усталость металлов и сплавов вызывают значительное снижение уровня прочности, сокращают срок службы изделия, провоцируя его разрушение из-за появления усталостных трещин. Все это негативно отражается на надежности, продолжительности работы и безотказности техники.
Исправить положение можно, повысив технический ресурс детали либо уменьшив скорость его снижения.
Причины возникновения усталости металла
Локальное перенапряжение приводит к появлению небольшой трещины на металлическом изделии, которая постепенно увеличивается в процессе его использования. В результате деталь ослабевает и резко выходит из строя при разрастании трещины до критических показателей. Это называется механической усталостью металлов.

Выделяют три этапа усталостного разрушения:
- Образование трещины.
- Распространение трещины.
- Разрушение материала.
Чтобы деталь использовалась в течение максимально долгого срока, не подвергаясь усталостному разрушению, а специалисты не задумывались, через сколько лет наступит усталость металла, важно не допускать превышение локальными напряжениями определенного значения, известного как предел выносливости.
Усталость металла определяется присутствием концентраторов напряжений, в качестве которых могут выступать отверстия, сварные соединения, зазубрины, очаги ржавчины. Не менее важно качество обработки поверхности изделия, так как гладкие плоскости менее подвержены усталостным процессам.
Усталостное разрушение деталей может быть разных типов в соответствии с причиной образования дефекта:
- перепады температуры – в этом случае говорят о термической усталости металла;
- совместные циклы давления и температуры;
- наличие очага коррозии;
- постоянная вибрация, исходящая от оборудования.
Как определить усталость металла
Экспериментальные методы исследования усталости металлов позволяют создавать надежные конструкций, которые служат долго и справляются с переменными нагрузками. Существуют испытания на усталость для хрупких, малопластичных и пластичных материалов, которые проводят в ускоренном или длительном режиме.

Нередко предел выносливости определяют в условиях симметричного цикла при помощи гладкого вращающегося образца либо имеющего надрез. Так как специалистам нужно определить усталость металла, прибегают к большому количеству циклов знакопеременных нагрузок. Испытание осуществляется при заданной нагрузке и завершается сразу после разрушения материала, далее фиксируют число выполненных циклов.
Меры повышения выносливости металла
Разрушение крепежных элементов является недопустимым. Избежать преждевременного проявления усталости металла можно таким образом:
- Прибегнуть к рационализации конструкции, то есть к увеличению радиуса скруглений, переходов между отдельными участками изделия, что позволяет избавиться от концентраторов напряжений.
- Выбирать материал, обладающий повышенным показателем прочности. Сюда относятся титан, легированная сталь, а также сталь с высоким содержанием углерода.
- Обеспечить более высокую прочность поверхности при помощи метода закалки с отпуском, азотирования, гальванической обработки металла для защиты от ржавчины.
- Постоянно затягивать резьбовой крепеж во время работы – практически полная защита от ослабления предварительной затяжки достигается при помощи стопорных клиновых шайб.
- Тщательно отслеживать качество затяжки соединений, если изготовитель указал величину момента затяжки.
- Защищать поверхности крепежа от воздействия извне, что позволяет избежать коррозионной усталости металла.
- Предельно серьезно отнестись к выбору типа крепежа, оценив несущую способность, которая требуется от подобных изделий в конкретной ситуации.
- Провести грамотный монтаж, благодаря чему удается исключить вибрации, слабину крепежа в рабочем состоянии – так, анкерный болт не должен болтаться при установке в пористый бетон, кирпич.
- Учесть класс пожаростойкости объекта, конструкции, ведь от этой характеристики зависит необходимость в изделиях с повышенным уровнем стойкости.
Разрушение металла в результате усталости происходит внезапно и связано с большим количеством нюансов, чем обычное. А значит, при проектировании объекта важно проанализировать показатели усталости. На данном этапе уже известен материал, который планируется использовать для проекта, и параметры среды – инженеру нужно выбрать ПО для оценки степени усталости всех элементов конструкций.
Усталость материала — процесс постепенного накопления повреждений в детали под действием переменных (часто циклических) напряжений, приводящий к изменению свойств материала, образованию трещин, их развитию и разрушению материала детали за указанное количество циклов нагружения. А разрушение как всегда может быть неожиданным для всех, если заранее трубопровод не был подвержен расчету на усталостную прочность.
Локальное перенапряжение компонента может вызвать небольшую трещину, которая медленно растет с последующими рабочими циклами, а компонент продолжает ослабевать. Когда трещина достигает критического размера, компонент резко выходит из строя без предупреждений. Такой отказ известен как усталостное разрушение металла.
Усталостное разрушение металла происходит в три стадии:
1. Появление трещины
2. Распространение трещины
3. Разрушение металла
Усталость металла напрямую связана с количеством циклов напряжения и величиной приложенного к ней напряжения. Если локальные напряжения поддерживаются ниже определенного значения, металл не будет иметь усталостного разрушения, и деталь будет работать удовлетворительно в течение бесконечного периода времени. Это предельное значение известно как предел выносливости материала.
На усталость металла в значительной степени так же влияет наличие концентраторов напряжения, таких как отверстия, зазубрины, сварные швы, коррозия и т.п. Качество поверхности детали также играет большую роль в усталостном разрушении металла. Гладкая поверхность увеличивает усталостную долговечность.
В зависимости от того, как происходит усталостное разрушение металлической детали, они могут быть сгруппированы по различным типам:
1. Разрушение из-за перепадов температур – температурной истории нагружений.
2. Усталостное разрушение из-за совместных циклов температуры и давления.
3. Усталостное разрушение из-за высококоррозионной среды, когда первоначальная трещина возникает в результате и в месте коррозии.
4. Разрушение из-за постоянной вибрации от механического оборудования. Этот тип усталости металла возникает из-за напряжений, возникающих с течением времени, и включает коррозию и усталостное разрушение из-за вибрации.
Очень важно определить грань, при которой материал, подвергаясь циклической нагрузке, будет работать. Для определения усталостной прочности материала в лабораториях образец для испытаний готовят в соответствии со стандартными инструкциями в результате чего, мы получаем кривые усталости, которые строятся при различных уровнях нагрузки и количестве циклов нагружения, до полного его отказа.
Пример диаграммы усталостного разрушения ниже.

При проектировании трубопровода необходимо учитывать различные факторы, чтобы увеличить его усталостную долговечность. Например, значительное увеличение прочности даёт химико-термическая обработка металлов, например, поверхностное азотирование или газотермическое напыление. Кроме этого, можно посоветовать следующие проектные решения:
1. Избегать острых углов: использование больших радиусов снизит уровни концентрации напряжений, что, в свою очередь, увеличит усталостную прочность металла.
2. Предотвращение резких изменений поперечного сечения: усталостную прочность металла можно увеличить за счет плавного перехода между поперечными сечениями.
3. Усталостная прочность материалов увеличивается с уменьшением шероховатости поверхности, поскольку отполированные поверхности устраняют концентраторы напряжения.
4. Сварка хорошего качества без включений, пористости или червоточин.
5. Выбор материалов с хорошими усталостными свойствами.
Как мы видим, усталостное разрушение более коварное, нежели чем обычное, поэтому так важно выполнить анализ усталости еще на этапе проектирования. Обычно на этой стадии, инженер уже знает материал, который будет использоваться в проекте, и рабочие параметры среды, поэтому ему остается только выбрать программное обеспечение, которое может выполнять анализ усталости различных компонентов.
Усталость металла: что это и как можно ей противостоять
Усталостью металла называют процесс постепенного накопления под воздействием внешних факторов в металлической конструкции микроскопических повреждений, которые в дальнейшем прогрессируют во все более крупные. Это частое явление, могущее привести к весьма плачевным итогам.
Первооткрывателем явления стал немецкий горный инженер Вильгельм Альберт, в 1829 году описавший по результатам своих экспериментов износ металла на примере повторяющихся изгибов звеньев цепей рудничных подъемников на разработанной им опытной машине. Однако термин «усталость металла» был введен лишь в 1839 году французским ученым Жаном-Виктором Понселе, описавшим уменьшение прочности стальных конструкций под воздействием циклических напряжений.
Еще чуть позже вклад в теорию усталости металла, а также проектирования металлических конструкций, подвергающихся циклическим напряжениям, внес немецкий инженер Август Вёллер, опубликовав в 1858—1870 годах результаты опытов с железом и сталью в условиях повторного растяжения-сжатия. Результаты его исследований в 1874 году графически представил в виде таблиц немецкий архитектор Льюис Шпангенберг. С тех пор наглядное представление полученной зависимости между амплитудами напряжения цикла и числом циклов до разрушения металлической конструкции называют диаграммой Вёллера.
С тех пор явление усталости металла получило свое четкое определение, как процесс накопления с течением определенного времени повреждений металлической конструкции под действием переменных (обычно циклических) напряжений, которые приводят к изменению свойств конструкции, образованию в ней трещин, их прогрессивному развитию и последующему разрушению материала.
Прогрессирующая усталость металла может привести к разрушению металлических конструкций. Как правило это происходит во время их работы (когда осуществляется максимальная нагрузка на механизмы), что может привести к авариям и катастрофам, в том числе, с человеческими жертвами. Примеры некоторых известнейших происшествий:
— версальская железнодорожная катастрофа в 1842 году, в итоге которой погибло 55 человек (причиной послужил усталостной излом оси паровоза).
— крушение скоростного электропоезда ICE у коммуны Эшеде в Германии в 1998 году, по результатом которого погиб 101 человек и 88 ранены (на скорости 200 км/ч у поезда лопнул бандаж колеса).
— авария на Саяно-Шушенской ГЭС в 2009 году (причиной стали усталостные повреждения узлов крепления гидроагрегата станции, в том числе и крышки турбины).
Усталость металла обычно предотвращают путем модификации частей металлической конструкции, дабы исключить циклические нагрузки, либо путем замены используемых в ней материалов на менее склонные к усталости. Также ощутимое увеличение выносливости конструкции дают некоторые способы химико-термической обработки металлов (азотирование, нитроцементация и т.д.). Еще одним методом профилактики усталости металла является газотермическое напыление, которое создает напряжение сжатия на поверхности материала, что способствует защите металлических деталей от разрушения.

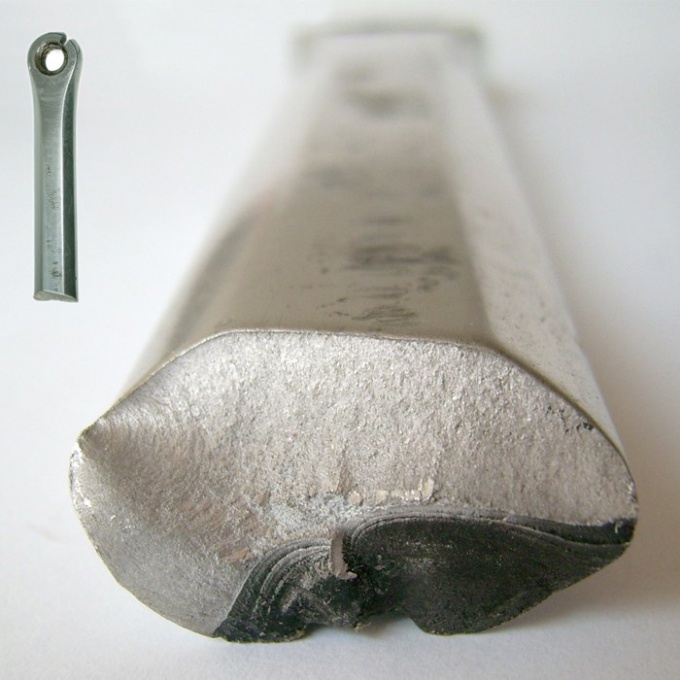
Fracture of an aluminium crank arm. Dark area of striations: slow crack growth. Bright granular area: sudden fracture.
In materials science, fatigue is the initiation and propagation of cracks in a material due to cyclic loading. Once a fatigue crack has initiated, it grows a small amount with each loading cycle, typically producing striations on some parts of the fracture surface. The crack will continue to grow until it reaches a critical size, which occurs when the stress intensity factor of the crack exceeds the fracture toughness of the material, producing rapid propagation and typically complete fracture of the structure.
Fatigue has traditionally been associated with the failure of metal components which led to the term metal fatigue. In the nineteenth century, the sudden failing of metal railway axles was thought to be caused by the metal crystallising because of the brittle appearance of the fracture surface, but this has since been disproved.[1] Most materials, such as composites, plastics and ceramics, seem to experience some sort of fatigue-related failure.[2]
To aid in predicting the fatigue life of a component, fatigue tests are carried out using coupons to measure the rate of crack growth by applying constant amplitude cyclic loading and averaging the measured growth of a crack over thousands of cycles. However, there are also a number of special cases that need to be considered where the rate of crack growth is significantly different compared to that obtained from constant amplitude testing. Such as the reduced rate of growth that occurs for small loads near the threshold or after the application of an overload; and the increased rate of crack growth associated with short cracks or after the application of an underload.[2]
If the loads are above a certain threshold, microscopic cracks will begin to initiate at stress concentrations such as holes, persistent slip bands (PSBs), composite interfaces or grain boundaries in metals.[3] The stress values that cause fatigue damage are typically much less than the yield strength of the material.
Stages of fatigue[edit]
Historically, fatigue has been separated into regions of high cycle fatigue that require more than 104 cycles to failure where stress is low and primarily elastic and low cycle fatigue where there is significant plasticity. Experiments have shown that low cycle fatigue is also crack growth.[4]
Fatigue failures, both for high and low cycles, all follow the same basic steps: crack initiation, crack growth stages I and II, and finally ultimate failure. To begin the process, cracks must nucleate within a material. This process can occur either at stress risers in metallic samples or at areas with a high void density in polymer samples. These cracks propagate slowly at first during stage I crack growth along crystallographic planes, where shear stresses are highest. Once the cracks reach a critical size they propagate quickly during stage II crack growth in a direction perpendicular to the applied force. These cracks can eventually lead to the ultimate failure of the material, often in a brittle catastrophic fashion.
Crack initiation[edit]
The formation of initial cracks preceding fatigue failure is a separate process consisting of four discrete steps in metallic samples. The material will develop cell structures and harden in response to the applied load. This causes the amplitude of the applied stress to increase given the new restraints on strain. These newly formed cell structures will eventually break down with the formation of persistent slip bands (PSBs). Slip in the material is localized at these PSBs, and the exaggerated slip can now serve as a stress concentrator for a crack to form. Nucleation and growth of a crack to a detectable size accounts for most of the cracking process. It is for this reason that cyclic fatigue failures seem to occur so suddenly where the bulk of the changes in the material are not visible without destructive testing. Even in normally ductile materials, fatigue failures will resemble sudden brittle failures.
PSB-induced slip planes result in intrusions and extrusions along the surface of a material, often occurring in pairs.[5] This slip is not a microstructural change within the material, but rather a propagation of dislocations within the material. Instead of a smooth interface, the intrusions and extrusions will cause the surface of the material to resemble the edge of a deck of cards, where not all cards are perfectly aligned. Slip-induced intrusions and extrusions create extremely fine surface structures on the material. With surface structure size inversely related to stress concentration factors, PSB-induced surface slip can cause fractures to initiate.
These steps can also be bypassed entirely if the cracks form at a pre-existing stress concentrator such as from an inclusion in the material or from a geometric stress concentrator caused by a sharp internal corner or fillet.
Crack growth[edit]
Most of the fatigue life is generally consumed in the crack growth phase. The rate of growth is primarily driven by the range of cyclic loading although additional factors such as mean stress, environment, overloads and underloads can also affect the rate of growth. Crack growth may stop if the loads are small enough to fall below a critical threshold.
Fatigue cracks can grow from material or manufacturing defects from as small as 10 μm.
When the rate of growth becomes large enough, fatigue striations can be seen on the fracture surface. Striations mark the position of the crack tip and the width of each striation represents the growth from one loading cycle. Striations are a result of plasticity at the crack tip.
When the stress intensity exceeds a critical value known as the fracture toughness, unsustainable fast fracture will occur, usually by a process of microvoid coalescence. Prior to final fracture, the fracture surface may contain a mixture of areas of fatigue and fast fracture.
Acceleration and retardation[edit]
The following effects change the rate of growth:[2]
- Mean stress effect: Higher mean stress increases the rate of crack growth.
- Environment: Increased moisture increases the rate of crack growth. In the case of aluminium, cracks generally grow from the surface, where water vapour from the atmosphere is able to reach the tip of the crack and dissociate into atomic hydrogen which causes hydrogen embrittlement. Cracks growing internally are isolated from the atmosphere and grow in a vacuum where the rate of growth is typically an order of magnitude slower than a surface crack.[6]
- Short crack effect: In 1975, Pearson observed that short cracks grow faster than expected.[7] Possible reasons for the short crack effect include the presence of the T-stress, the tri-axial stress state at the crack tip, the lack of crack closure associated with short cracks and the large plastic zone in comparison to the crack length. In addition, long cracks typically experience a threshold which short cracks do not have.[8] There are a number of criteria for short cracks:[9]
- cracks are typically smaller than 1 mm,
- cracks are smaller than the material microstructure size such as the grain size, or
- crack length is small compared to the plastic zone.
- Underloads: Small numbers of underloads increase the rate of growth and may counteract the effect of overloads.
- Overloads: Initially overloads (> 1.5 the maximum load in a sequence) lead to a small increase in the rate of growth followed by a long reduction in the rate of growth.
Characteristics of fatigue[edit]
- In metal alloys, and for the simplifying case when there are no macroscopic or microscopic discontinuities, the process starts with dislocation movements at the microscopic level, which eventually form persistent slip bands that become the nucleus of short cracks.
- Macroscopic and microscopic discontinuities (at the crystalline grain scale) as well as component design features which cause stress concentrations (holes, keyways, sharp changes of load direction etc.) are common locations at which the fatigue process begins.
- Fatigue is a process that has a degree of randomness (stochastic), often showing considerable scatter even in seemingly identical samples in well controlled environments.
- Fatigue is usually associated with tensile stresses but fatigue cracks have been reported due to compressive loads.[10]
- The greater the applied stress range, the shorter the life.
- Fatigue life scatter tends to increase for longer fatigue lives.
- Damage is irreversible. Materials do not recover when rested.
- Fatigue life is influenced by a variety of factors, such as temperature, surface finish, metallurgical microstructure, presence of oxidizing or inert chemicals, residual stresses, scuffing contact (fretting), etc.
- Some materials (e.g., some steel and titanium alloys) exhibit a theoretical fatigue limit below which continued loading does not lead to fatigue failure.
- High cycle fatigue strength (about 104 to 108 cycles) can be described by stress-based parameters. A load-controlled servo-hydraulic test rig is commonly used in these tests, with frequencies of around 20–50 Hz. Other sorts of machines—like resonant magnetic machines—can also be used, to achieve frequencies up to 250 Hz.
- Low-cycle fatigue (loading that typically causes failure in less than 104 cycles) is associated with localized plastic behavior in metals; thus, a strain-based parameter should be used for fatigue life prediction in metals. Testing is conducted with constant strain amplitudes typically at 0.01–5 Hz.
Timeline of research history[edit]
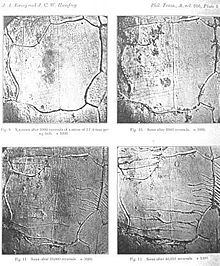
Micrographs showing how surface fatigue cracks grow as material is further cycled. From Ewing & Humfrey, 1903
- 1837: Wilhelm Albert publishes the first article on fatigue. He devised a test machine for conveyor chains used in the Clausthal mines.[11]
- 1839: Jean-Victor Poncelet describes metals as being ‘tired’ in his lectures at the military school at Metz.
- 1842: William John Macquorn Rankine recognises the importance of stress concentrations in his investigation of railroad axle failures. The Versailles train wreck was caused by fatigue failure of a locomotive axle.[12]
- 1843: Joseph Glynn reports on the fatigue of an axle on a locomotive tender. He identifies the keyway as the crack origin.
- 1848: The Railway Inspectorate reports one of the first tyre failures, probably from a rivet hole in tread of railway carriage wheel. It was likely a fatigue failure.
- 1849: Eaton Hodgkinson is granted a «small sum of money» to report to the UK Parliament on his work in «ascertaining by direct experiment, the effects of continued changes of load upon iron structures and to what extent they could be loaded without danger to their ultimate security».
- 1854: F. Braithwaite reports on common service fatigue failures and coins the term fatigue.[13]
- 1860: Systematic fatigue testing undertaken by Sir William Fairbairn and August Wöhler.
- 1870: A. Wöhler summarises his work on railroad axles. He concludes that cyclic stress range is more important than peak stress and introduces the concept of endurance limit.[11]
- 1903: Sir James Alfred Ewing demonstrates the origin of fatigue failure in microscopic cracks.
- 1910: O. H. Basquin proposes a log-log relationship for S-N curves, using Wöhler’s test data.[14]
- 1940: Sidney M. Cadwell publishes first rigorous study of fatigue in rubber.[15]
- 1945: A. M. Miner popularises Palmgren’s (1924) linear damage hypothesis as a practical design tool.[16][17]
- 1952: W. Weibull An S-N curve model.[18]
- 1954: The world’s first commercial jetliner, the de Havilland Comet, suffers disaster as three planes break up in mid-air, causing de Havilland and all other manufacturers to redesign high altitude aircraft and in particular replace square apertures like windows with oval ones.
- 1954: L. F. Coffin and S. S. Manson explain fatigue crack-growth in terms of plastic strain in the tip of cracks.
- 1961: P. C. Paris proposes methods for predicting the rate of growth of individual fatigue cracks in the face of initial scepticism and popular defence of Miner’s phenomenological approach.
- 1968: Tatsuo Endo and M. Matsuishi devise the rainflow-counting algorithm and enable the reliable application of Miner’s rule to random loadings.[19]
- 1970: W. Elber elucidates the mechanisms and importance of crack closure in slowing the growth of a fatigue crack due to the wedging effect of plastic deformation left behind the tip of the crack.[20][21]
- 1973: M. W. Brown and K. J. Miller observe that fatigue life under multiaxial conditions is governed by the experience of the plane receiving the most damage, and that both tension and shear loads on the critical plane must be considered.[22]
Predicting fatigue life[edit]
The American Society for Testing and Materials defines fatigue life, Nf, as the number of stress cycles of a specified character that a specimen sustains before failure of a specified nature occurs.[23] For some materials, notably steel and titanium, there is a theoretical value for stress amplitude below which the material will not fail for any number of cycles, called a fatigue limit or endurance limit.[24] However, in practice, several bodies of work done at greater numbers of cycles suggest that fatigue limits do not exist for any metals.[25][26][27]
Engineers have used a number of methods to determine the fatigue life of a material:[28]
- the stress-life method,
- the strain-life method,
- the crack growth method and
- probabilistic methods, which can be based on either life or crack growth methods.
Whether using stress/strain-life approach or using crack growth approach, complex or variable amplitude loading is reduced to a series of fatigue equivalent simple cyclic loadings using a technique such as the rainflow-counting algorithm.
Stress-life and strain-life methods[edit]
A mechanical part is often exposed to a complex, often random, sequence of loads, large and small. In order to assess the safe life of such a part using the fatigue damage or stress/strain-life methods the following series of steps is usually performed:
- Complex loading is reduced to a series of simple cyclic loadings using a technique such as rainflow analysis;
- A histogram of cyclic stress is created from the rainflow analysis to form a fatigue damage spectrum;
- For each stress level, the degree of cumulative damage is calculated from the S-N curve; and
- The effect of the individual contributions are combined using an algorithm such as Miner’s rule.
Since S-N curves are typically generated for uniaxial loading, some equivalence rule is needed whenever the loading is multiaxial. For simple, proportional loading histories (lateral load in a constant ratio with the axial), Sines rule may be applied. For more complex situations, such as non-proportional loading, critical plane analysis must be applied.
Miner’s rule[edit]
In 1945, M.A. Miner popularised a rule that had first been proposed by A. Palmgren in 1924.[16] The rule, variously called Miner’s rule or the Palmgren-Miner linear damage hypothesis, states that where there are k different stress magnitudes in a spectrum, Si (1 ≤ i ≤ k), each contributing ni(Si) cycles, then if Ni(Si) is the number of cycles to failure of a constant stress reversal Si (determined by uni-axial fatigue tests), failure occurs when:

Usually, for design purposes, C is assumed to be 1. This can be thought of as assessing what proportion of life is consumed by a linear combination of stress reversals at varying magnitudes.
Although Miner’s rule may be a useful approximation in many circumstances, it has several major limitations:
- It fails to recognize the probabilistic nature of fatigue and there is no simple way to relate life predicted by the rule with the characteristics of a probability distribution. Industry analysts often use design curves, adjusted to account for scatter, to calculate Ni(Si).
- The sequence in which high vs. low stress cycles are applied to a sample in fact affect the fatigue life, for which Miner’s Rule does not account. In some circumstances, cycles of low stress followed by high stress cause more damage than would be predicted by the rule.[29] It does not consider the effect of an overload or high stress which may result in a compressive residual stress that may retard crack growth. High stress followed by low stress may have less damage due to the presence of compressive residual stress (or localized plastic damages around crack tip).
Stress-life (S-N) method[edit]

S-N curve for a brittle aluminium with an ultimate tensile strength of 320 MPa
Materials fatigue performance is commonly characterized by an S-N curve, also known as a Wöhler curve. This is often plotted with the cyclic stress (S) against the cycles to failure (N) on a logarithmic scale.[30] S-N curves are derived from tests on samples of the material to be characterized (often called coupons or specimens) where a regular sinusoidal stress is applied by a testing machine which also counts the number of cycles to failure. This process is sometimes known as coupon testing. For greater accuracy but lower generality component testing is used.[31] Each coupon or component test generates a point on the plot though in some cases there is a runout where the time to failure exceeds that available for the test (see censoring). Analysis of fatigue data requires techniques from statistics, especially survival analysis and linear regression.
The progression of the S-N curve can be influenced by many factors such as stress ratio (mean stress),[32] loading frequency, temperature, corrosion, residual stresses, and the presence of notches. A constant fatigue life (CFL) diagram[33] is useful for the study of stress ratio effect. The Goodman line is a method used to estimate the influence of the mean stress on the fatigue strength.
A Constant Fatigue Life (CFL) diagram is useful for stress ratio effect on S-N curve.[34] Also, in the presence of a steady stress superimposed on the cyclic loading, the Goodman relation can be used to estimate a failure condition. It plots stress amplitude against mean stress with the fatigue limit and the ultimate tensile strength of the material as the two extremes. Alternative failure criteria include Soderberg and Gerber.[35]
As coupons sampled from a homogeneous frame will display a variation in their number of cycles to failure, the S-N curve should more properly be a Stress-Cycle-Probability (S-N-P) curve to capture the probability of failure after a given number of cycles of a certain stress.
With body-centered cubic materials (bcc), the Wöhler curve often becomes a horizontal line with decreasing stress amplitude, i.e. there is a fatigue strength that can be assigned to these materials. With face-centered cubic metals (fcc), the Wöhler curve generally drops continuously, so that only a fatigue limit can be assigned to these materials.[36]
Strain-life (ε-N) method[edit]

Graph showing fatigue failure as a function of strain amplitude.
When strains are no longer elastic, such as in the presence of stress concentrations, the total strain can be used instead of stress as a similitude parameter. This is known as the strain-life method. The total strain amplitude  is the sum of the elastic strain amplitude
  and the plastic strain amplitude
  and is given by[2][37]
-
 .
.

Basquin’s equation for the elastic strain amplitude is

where  is Young’s modulus.
The relation for high cycle fatigue can be expressed using the elastic strain amplitude

where  is a parameter that scales with tensile strength obtained by fitting experimental data,
  is the number of cycles to failure and
  is the slope of the log-log curve again determined by curve fitting.
In 1954, Coffin and Manson proposed that the fatigue life of a component was related to the plastic strain amplitude using
-
- .

Combining the elastic and plastic portions gives the total strain amplitude accounting for both low and high cycle fatigue
-
- .

where  is the fatigue strength coefficient, is the fatigue strength exponent,
  is the fatigue ductility coefficient,
  is the fatigue ductility exponent, and
  is the number of cycles to failure (
 being the number of reversals to failure).
Crack growth methods[edit]
An estimate of the fatigue life of a component can be made using a crack growth equation by summing up the width of each increment of crack growth for each loading cycle. Safety or scatter factors are applied to the calculated life to account for any uncertainty and variability associated with fatigue. The rate of growth used in crack growth predictions is typically measured by applying thousands of constant amplitude cycles to a coupon and measuring the rate of growth from the change in compliance of the coupon or by measuring the growth of the crack on the surface of the coupon. Standard methods for measuring the rate of growth have been developed by ASTM International.[9]
Crack growth equations such as the Paris–Erdoğan equation are used to predict the life of a component. They can be used to predict the growth of a crack from 10 um to failure. For normal manufacturing finishes this may cover most of the fatigue life of a component where growth can start from the first cycle.[4] The conditions at the crack tip of a component are usually related to the conditions of test coupon using a characterising parameter such as the stress intensity, J-integral or crack tip opening displacement. All these techniques aim to match the crack tip conditions on the component to that of test coupons which give the rate of crack growth.
Additional models may be necessary to include retardation and acceleration effects associated with overloads or underloads in the loading sequence. In addition, small crack growth data may be needed to match the increased rate of growth seen with small cracks.[38]
Typically, a cycle counting technique such as rainflow-cycle counting is used to extract the cycles from a complex sequence. This technique, along with others, has been shown to work with crack growth methods.[39]
Crack growth methods have the advantage that they can predict the intermediate size of cracks. This information can be used to schedule inspections on a structure to ensure safety whereas strain/life methods only give a life until failure.
Dealing with fatigue[edit]

Fracture surface in a glass rod showing beach marks surrounding the initiation site.
Design[edit]
Dependable design against fatigue-failure requires thorough education and supervised experience in structural engineering, mechanical engineering, or materials science. There are at least five principal approaches to life assurance for mechanical parts that display increasing degrees of sophistication:[40]
- Design to keep stress below threshold of fatigue limit (infinite lifetime concept);
- Fail-safe, graceful degradation, and fault-tolerant design: Instruct the user to replace parts when they fail. Design in such a way that there is no single point of failure, and so that when any one part completely fails, it does not lead to catastrophic failure of the entire system.
- Safe-life design: Design (conservatively) for a fixed life after which the user is instructed to replace the part with a new one (a so-called lifed part, finite lifetime concept, or «safe-life» design practice); planned obsolescence and disposable product are variants that design for a fixed life after which the user is instructed to replace the entire device;
- Damage tolerance: Is an approach that ensures aircraft safety by assuming the presence of cracks or defects even in new aircraft. Crack growth calculations, periodic inspections and component repair or replacement can be used to ensure critical components that may contain cracks, remain safe. Inspections usually use nondestructive testing to limit or monitor the size of possible cracks and require an accurate prediction of the rate of crack-growth between inspections. The designer sets some aircraft maintenance checks schedule frequent enough that parts are replaced while the crack is still in the «slow growth» phase. This is often referred to as damage tolerant design or «retirement-for-cause».
- Risk Management: Ensures the probability of failure remains below an acceptable level. This approach is typically used for aircraft where acceptable levels may be based on probability of failure during a single flight or taken over the lifetime of an aircraft. A component is assumed to have a crack with a probability distribution of crack sizes. This approach can consider variability in values such as crack growth rates, usage and critical crack size.[41] It is also useful for considering damage at multiple locations that may interact to produce multi-site or widespread fatigue damage. Probability distributions that are common in data analysis and in design against fatigue include the log-normal distribution, extreme value distribution, Birnbaum–Saunders distribution, and Weibull distribution.
Testing[edit]
Fatigue testing can be used for components such as a coupon or a full-scale test article to determine:
- the rate of crack growth and fatigue life of components such as a coupon or a full-scale test article.
- location of critical regions
- degree of fail-safety when part of the structure fails
- the origin and cause of the crack initiating defect from fractographic examination of the crack.
These tests may form part of the certification process such as for airworthiness certification.
Repair[edit]
- Stop drill Fatigue cracks that have begun to propagate can sometimes be stopped by drilling holes, called drill stops, at the tip of the crack.[42] The possibility remains of a new crack starting in the side of the hole.
- Blend. Small cracks can be blended away and the surface cold worked or shot peened.
- Oversize holes. Holes with cracks growing from them can be drilled out to a larger hole to remove cracking and bushed to restore the original hole. Bushes can be cold shrink Interference fit bushes to induce beneficial compressive residual stresses. The oversized hole can also be cold worked by drawing an oversized mandrel through the hole.[43]
- Patch. Cracks may be repaired by installing a patch or repair fitting. Composite patches have been used to restore the strength of aircraft wings after cracks have been detected or to lower the stress prior to cracking in order to improve the fatigue life.[44] Patches may restrict the ability to monitor fatigue cracks and may need to be removed and replaced for inspections.
Life improvement[edit]

Example of a HFMI treated steel highway bridge to avoid fatigue along the weld transition.
- Change material. Changes in the materials used in parts can also improve fatigue life. For example, parts can be made from better fatigue rated metals. Complete replacement and redesign of parts can also reduce if not eliminate fatigue problems. Thus helicopter rotor blades and propellers in metal are being replaced by composite equivalents. They are not only lighter, but also much more resistant to fatigue. They are more expensive, but the extra cost is amply repaid by their greater integrity, since loss of a rotor blade usually leads to total loss of the aircraft. A similar argument has been made for replacement of metal fuselages, wings and tails of aircraft.[45]
- Induce residual stresses Peening a surface can reduce such tensile stresses and create compressive residual stress, which prevents crack initiation. Forms of peening include: shot peening, using high-speed projectiles, high-frequency impact treatment (also called high-frequency mechanical impact) using a mechanical hammer,[46][47] and laser peening which uses high-energy laser pulses. Low plasticity burnishing can also be used to induce compresses stress in fillets and cold work mandrels can be used for holes.[48] Increases in fatigue life and strength are proportionally related to the depth of the compressive residual stresses imparted. Shot peening imparts compressive residual stresses approximately 0.005 inches (0.1 mm) deep, while laser peening can go 0.040 to 0.100 inches (1 to 2.5 mm) deep, or deeper.[49][failed verification]
- Deep cryogenic treatment. The use of Deep Cryogenic treatment has been shown to increase resistance to fatigue failure. Springs used in industry, auto racing and firearms have been shown to last up to six times longer when treated. Heat checking, which is a form of thermal cyclic fatigue has been greatly delayed.[50]
- Re-profiling. Changing the shape of a stress concentration such as a hole or cutout may be used to extend the life of a component. Shape optimisation using numerical optimisation algorithms have been used to lower the stress concentration in wings and increase their life.[51]
Fatigue of composites[edit]
Composite materials can offer excellent resistance to fatigue loading. In general, composites exhibit good fracture toughness and, unlike metals, increase fracture toughness with increasing strength. The critical damage size in composites is also greater than that for metals.[52]
The primary mode of damage in a metal structure is cracking. For metal, cracks propagate in a relatively well-defined manner with respect to the applied stress, and the critical crack size and rate of crack propagation can be related to specimen data through analytical fracture mechanics. However, with composite structures, there is no single damage mode which dominates. Matrix cracking, delamination, debonding, voids, fiber fracture, and composite cracking can all occur separately and in combination, and the predominance of one or more is highly dependent on the laminate orientations and loading conditions.[53] In addition, the unique joints and attachments used for composite structures often introduce modes of failure different from those typified by the laminate itself.[54]
The composite damage propagates in a less regular manner and damage modes can change. Experience with composites indicates that the rate of damage propagation in does not exhibit the two distinct regions of initiation and propagation like metals. The crack initiation range in metals is propagation, and there is a significant quantitative difference in rate while the difference appears to be less apparent with composites.[53] Fatigue cracks of composites may form in the matrix and propagate slowly since the matrix carries such a small fraction of the applied stress. And the fibers in the wake of the crack experience fatigue damage. In many cases, the damage rate is accelerated by deleterious interactions with the environment like oxidation or corrosion of fibers.[55]
Notable fatigue failures[edit]
Versailles train crash[edit]

Versailles train disaster

Drawing of a fatigue failure in an axle by Joseph Glynn, 1843
Following the King Louis-Philippe I’s celebrations at the Palace of Versailles, a train returning to Paris crashed in May 1842 at Meudon after the leading locomotive broke an axle. The carriages behind piled into the wrecked engines and caught fire. At least 55 passengers were killed trapped in the locked carriages, including the explorer Jules Dumont d’Urville. This accident is known in France as the «Catastrophe ferroviaire de Meudon». The accident was witnessed by the British locomotive engineer Joseph Locke and widely reported in Britain. It was discussed extensively by engineers, who sought an explanation.
The derailment had been the result of a broken locomotive axle. Rankine’s investigation of broken axles in Britain highlighted the importance of stress concentration, and the mechanism of crack growth with repeated loading. His and other papers suggesting a crack growth mechanism through repeated stressing, however, were ignored, and fatigue failures occurred at an ever-increasing rate on the expanding railway system. Other spurious theories seemed to be more acceptable, such as the idea that the metal had somehow «crystallized». The notion was based on the crystalline appearance of the fast fracture region of the crack surface, but ignored the fact that the metal was already highly crystalline.
de Havilland Comet[edit]

The recovered (shaded) parts of the wreckage of G-ALYP and the site (arrowed) of the failure
Two de Havilland Comet passenger jets broke up in mid-air and crashed within a few months of each other in 1954. As a result, systematic tests were conducted on a fuselage immersed and pressurised in a water tank. After the equivalent of 3,000 flights, investigators at the Royal Aircraft Establishment (RAE) were able to conclude that the crash had been due to failure of the pressure cabin at the forward Automatic Direction Finder window in the roof. This ‘window’ was in fact one of two apertures for the aerials of an electronic navigation system in which opaque fibreglass panels took the place of the window ‘glass’. The failure was a result of metal fatigue caused by the repeated pressurisation and de-pressurisation of the aircraft cabin. Also, the supports around the windows were riveted, not bonded, as the original specifications for the aircraft had called for. The problem was exacerbated by the punch rivet construction technique employed. Unlike drill riveting, the imperfect nature of the hole created by punch riveting caused manufacturing defect cracks which may have caused the start of fatigue cracks around the rivet.

The fuselage roof fragment of G-ALYP on display in the Science Museum in London, showing the two ADF windows at which the initial failure occurred.[56]
The Comet’s pressure cabin had been designed to a safety factor comfortably in excess of that required by British Civil Airworthiness Requirements (2.5 times the cabin proof test pressure as opposed to the requirement of 1.33 times and an ultimate load of 2.0 times the cabin pressure) and the accident caused a revision in the estimates of the safe loading strength requirements of airliner pressure cabins.
In addition, it was discovered that the stresses around pressure cabin apertures were considerably higher than had been anticipated, especially around sharp-cornered cut-outs, such as windows. As a result, all future jet airliners would feature windows with rounded corners, greatly reducing the stress concentration. This was a noticeable distinguishing feature of all later models of the Comet. Investigators from the RAE told a public inquiry that the sharp corners near the Comets’ window openings acted as initiation sites for cracks. The skin of the aircraft was also too thin, and cracks from manufacturing stresses were present at the corners.
Alexander L. Kielland oil platform capsizing[edit]

Fractures on the right side of the Alexander L. Kielland rig
The Alexander L. Kielland was a Norwegian semi-submersible drilling rig that capsized whilst working in the Ekofisk oil field in March 1980, killing 123 people. The capsizing was the worst disaster in Norwegian waters since World War II. The rig, located approximately 320 km east of Dundee, Scotland, was owned by the Stavanger Drilling Company of Norway and was on hire to the United States company Phillips Petroleum at the time of the disaster. In driving rain and mist, early in the evening of 27 March 1980 more than 200 men were off duty in the accommodation on the Alexander L. Kielland. The wind was gusting to 40 knots with waves up to 12 m high. The rig had just been winched away from the Edda production platform. Minutes before 18:30 those on board felt a ‘sharp crack’ followed by ‘some kind of trembling’. Suddenly the rig heeled over 30° and then stabilised. Five of the six anchor cables had broken, with one remaining cable preventing the rig from capsizing. The list continued to increase and at 18:53 the remaining anchor cable snapped and the rig turned upside down.
A year later in March 1981, the investigative report[57] concluded that the rig collapsed owing to a fatigue crack in one of its six bracings (bracing D-6), which connected the collapsed D-leg to the rest of the rig. This was traced to a small 6 mm fillet weld which joined a non-load-bearing flange plate to this D-6 bracing. This flange plate held a sonar device used during drilling operations. The poor profile of the fillet weld contributed to a reduction in its fatigue strength. Further, the investigation found considerable amounts of lamellar tearing in the flange plate and cold cracks in the butt weld. Cold cracks in the welds, increased stress concentrations due to the weakened flange plate, the poor weld profile, and cyclical stresses (which would be common in the North Sea), seemed to collectively play a role in the rig’s collapse.
Others[edit]
- The 1862 Hartley Colliery Disaster was caused by the fracture of a steam engine beam and killed 204 people.
- The 1919 Boston Great Molasses Flood has been attributed to a fatigue failure.
- The 1948 Northwest Airlines Flight 421 crash due to fatigue failure in a wing spar root
- The 1957 «Mt. Pinatubo», presidential plane of Philippine President Ramon Magsaysay, crashed due to engine failure caused by metal fatigue.
- The 1965 capsize of the UK’s first offshore oil platform, the Sea Gem, was due to fatigue in part of the suspension system linking the hull to the legs.
- The 1968 Los Angeles Airways Flight 417 lost one of its main rotor blades due to fatigue failure.
- The 1968 MacRobertson Miller Airlines Flight 1750 lost a wing due to improper maintenance leading to fatigue failure.
- The 1969 F-111A crash due to a fatigue failure of the wing pivot fitting from a material defect resulted in the development of the damage- tolerant approach for fatigue design.[58]
- The 1977 Dan-Air Boeing 707 crash caused by fatigue failure resulting in the loss of the right horizontal stabilizer.
- The 1979 American Airlines Flight 191 crashed after engine separation attributed to fatigue damage in the pylon structure holding the engine to the wing, caused by improper maintenance procedures.
- The 1980 LOT Flight 7 crashed due to fatigue in an engine turbine shaft resulting in engine disintegration leading to loss of control.
- The 1985 Japan Airlines Flight 123 crashed after the aircraft lost its vertical stabilizer due to faulty repairs on the rear bulkhead.
- The 1988 Aloha Airlines Flight 243 suffered an explosive decompression at 24,000 feet (7,300 m) after a fatigue failure.
- The 1989 United Airlines Flight 232 lost its tail engine due to fatigue failure in a fan disk hub.
- The 1992 El Al Flight 1862 lost both engines on its right-wing due to fatigue failure in the pylon mounting of the #3 Engine.
- The 1998 Eschede train disaster was caused by fatigue failure of a single composite wheel.
- The 2000 Hatfield rail crash was likely caused by rolling contact fatigue.
- The 2000 recall of 6.5 million Firestone tires on Ford Explorers originated from fatigue crack growth leading to separation of the tread from the tire.[59]
- The 2002 China Airlines Flight 611 disintegrated in-flight due to fatigue failure.
- The 2005 Chalk’s Ocean Airways Flight 101 lost its right wing due to fatigue failure brought about by inadequate maintenance practices.
- The 2009 Viareggio train derailment due to fatigue failure.
- The 2009 Sayano–Shushenskaya power station accident due to metal fatigue of turbine mountings.
- The 2017 Air France Flight 66 had in-flight engine failure due to cold dwell fatigue fracture in the fan hub.
See also[edit]
- Aviation safety – State in which risks associated with aviation are at an acceptable level
- Critical plane analysis – Analysis of multiaxial stresses and strains
- Embedment
- Forensic materials engineering – branch of forensic engineering
- Fractography – Study of the fracture surfaces of materials
- Solder fatigue – Degradation of solder due to deformation under cyclic loading
- Thermo-mechanical fatigue
- Vibration fatigue
- International Journal of Fatigue
References[edit]
- ^ Schijve, J. (2003). «Fatigue of structures and materials in the 20th century and the state of the art». International Journal of Fatigue. 25 (8): 679–702. doi:10.1016/S0142-1123(03)00051-3.
- ^ a b c d Suresh, S. (2004). Fatigue of Materials. Cambridge University Press. ISBN 978-0-521-57046-6.
- ^ Kim, W. H.; Laird, C. (1978). «Crack nucleation and stage I propagation in high strain fatigue—II. mechanism». Acta Metallurgica. 26 (5): 789–799. doi:10.1016/0001-6160(78)90029-9.
- ^ a b Murakami, Y.; Miller, K. J. (2005). «What is fatigue damage? A view point from the observation of low cycle fatigue process». International Journal of Fatigue. 27 (8): 991–1005. doi:10.1016/j.ijfatigue.2004.10.009.
- ^ Forsythe, P. J. E. (1953). «Exudation of material from slip bands at the surface of fatigued crystals of an aluminium-copper alloy». Nature. 171 (4343): 172–173. Bibcode:1953Natur.171..172F. doi:10.1038/171172a0. S2CID 4268548.
- ^ Schijve, J. (1978). «Internal fatigue cracks are growing in vacuum». Engineering Fracture Mechanics. 10 (2): 359–370. doi:10.1016/0013-7944(78)90017-6.
- ^ Pearson, S. (1975). «Initiation of fatigue cracks in commercial aluminium alloys and the subsequent propagation of very short cracks». Engineering Fracture Mechanics. 7 (2): 235–247. doi:10.1016/0013-7944(75)90004-1.
- ^ Pippan, R.; Hohenwarter, A. (2017). «Fatigue crack closure: a review of the physical phenomena». Fatigue & Fracture of Engineering Materials & Structures. 40 (4): 471–495. doi:10.1111/ffe.12578. PMC 5445565. PMID 28616624.
- ^ a b ASTM Committee E08.06 (2013). E647 Standard Test Method for Measurement of Fatigue Crack Growth Rates (Technical report). ASTM International. E647-13.
- ^ Fleck, N. A.; Shin, C. S.; Smith, R.A. (1985). «Fatigue Crack Growth Under Compressive Loading». Engineering Fracture Mechanics. 21 (1): 173–185. doi:10.1016/0013-7944(85)90063-3.
- ^ a b Schutz, W. (1996). «A history of fatigue». Engineering Fracture Mechanics. 54 (2): 263–300. doi:10.1016/0013-7944(95)00178-6.
- ^ Rankine, W. J. M. (1843). «On the causes of the unexpected breakage of the journals of railway axles, and on the means of preventing such accidents by observing the law of continuity in their construction». Minutes of the Proceedings of the Institution of Civil Engineers. 2 (1843): 105–107. doi:10.1680/imotp.1843.24600.
- ^ Braithwaite, F. (1854). «On the fatigue and consequent fracture of metals». Minutes of the Proceedings of the Institution of Civil Engineers. 13 (1854): 463–467. doi:10.1680/imotp.1854.23960.
- ^ Basquin, O. H. (1910). «The exponential law of endurance test». Proceedings of the American Society for Testing and Materials. 10: 625–630.
- ^ Cadwell, Sidney; Merrill; Sloman; Yost (1940). «Dynamic fatigue life of rubber». Rubber Chemistry and Technology. 13 (2): 304–315. doi:10.5254/1.3539515.
- ^ a b Miner, M. A. (1945). «Cumulative damage in fatigue». Journal of Applied Mechanics. 12: 149–164.
- ^ Palmgren, A. G. (1924). «Die Lebensdauer von Kugellagern» [Life Length of Roller Bearings]. Zeitschrift des Vereines Deutscher Ingenieure (in German). 68 (14): 339–341.
- ^ Murray, W.M., ed. (1952). «The statistical aspect of fatigue failure and its consequences». Fatigue and Fracture of Metals. Technology Press of the Massachusetts Institute of Technology/Wiley. pp. 182–196.
- ^ Matsuishi, M.; Endo, T. (1968). Fatigue of Metals Subjected to Varying Stress. Japan Society of Mechanical Engineers.
- ^ Elber, Wolf (1970). «Fatigue crack closure under cyclic tension». Engineering Fracture Mechanics. 2: 37–45.
- ^ Elber, Wolf (1971). The Significance of Fatigue Crack Closure, ASTM STP 486. American Society for Testing and Materials. pp. 230–243.
- ^ Brown, M. W.; Miller, K. J. (1973). «A theory for fatigue failure under multiaxial stress-strain conditions». Proceedings of the Institution of Mechanical Engineers. 187 (1): 745–755. doi:10.1243/PIME_PROC_1973_187_161_02.
- ^ Stephens, R. I.; Fuchs, H. O. (2001). Metal Fatigue in Engineering (2nd ed.). John Wiley & Sons. p. 69. ISBN 978-0-471-51059-8.
- ^ Bathias, C. (1999). «There is no infinite fatigue life in metallic materials». Fatigue & Fracture of Engineering Materials & Structures. 22 (7): 559–565. doi:10.1046/j.1460-2695.1999.00183.x.
- ^ Pyttel, B.; Schwerdt, D.; Berger, C. (2011-01-01). «Very high cycle fatigue – Is there a fatigue limit?». International Journal of Fatigue. Advances in Very High Cycle Fatigue. 33 (1): 49–58. doi:10.1016/j.ijfatigue.2010.05.009. ISSN 0142-1123.
- ^ Sonsino, C (December 2007). «Course of SN-curves especially in the high-cycle fatigue regime with regard to component design and safety». International Journal of Fatigue. 29 (12): 2246–2258. doi:10.1016/j.ijfatigue.2006.11.015.
- ^ Mughrabi, H. (2002). «On ‘multi-stage’ fatigue life diagrams and the relevant life-controlling mechanisms in ultrahigh-cycle fatigue». Fatigue & Fracture of Engineering Materials & Structures. 25 (8–9): 755–764. doi:10.1046/j.1460-2695.2002.00550.x. ISSN 1460-2695.
- ^ Shigley, J. E.; Mischke, C. R.; Budynas, R. G. (2003). Mechanical Engineering Design (7th ed.). McGraw Hill Higher Education. ISBN 978-0-07-252036-1.
- ^ Eskandari, H.; Kim, H. S. (2017). «A theory for mathematical framework and fatigue damage function for S-N plane». In Wei, Z.; Nikbin, K.; McKeighan, P. C.; Harlow, G. D. (eds.). Fatigue and Fracture Test Planning, Test Data Acquisitions and Analysis. ASTM Selected Technical Papers. Vol. 1598. pp. 299–336. doi:10.1520/STP159820150099. ISBN 978-0-8031-7639-3.
- ^ Burhan, Ibrahim; Kim, Ho Sung (September 2018). «S-N Curve Models for Composite Materials Characterisation: An Evaluative Review». Journal of Composites Science. 2 (3): 38–66. doi:10.3390/jcs2030038.
- ^ Weibull, Waloddi (1961). Fatigue testing and analysis of results. Oxford: Published for Advisory Group for Aeronautical Research and development, North Atlantic Treaty Organization, by Pergamon Press. ISBN 978-0-08-009397-0. OCLC 596184290.
- ^ Kim, Ho Sung (2019-01-01). «Prediction of S-N curves at various stress ratios for structural materials». Procedia Structural Integrity. Fatigue Design 2019, International Conference on Fatigue Design, 8th Edition. 19: 472–481. doi:10.1016/j.prostr.2019.12.051. ISSN 2452-3216.
- ^ Kawai, M.; Itoh, N. (2014). «A failure-mode based anisomorphic constant life diagram for a unidirectional carbon/epoxy laminate under off-axis fatigue loading at room temperature». Journal of Composite Materials. 48 (5): 571–592. Bibcode:2014JCoMa..48..571K. CiteSeerX 10.1.1.826.6050. doi:10.1177/0021998313476324. S2CID 137221135.
- ^ Kim, H. S. (2016). Mechanics of Solids and Fracture (2nd ed.). Ventus Publishing. ISBN 978-87-403-1395-6.
- ^ Beardmore, R. (13 January 2013). «Fatigue Stress Action Types». Roymechx. Archived from the original on 12 January 2017. Retrieved 29 April 2012.
- ^ tec-science (2018-07-13). «Fatigue test». tec-science. Retrieved 2019-10-25.
- ^ ASM Handbook, Volume 19 — Fatigue and Fracture. Materials Park, Ohio: ASM International. 1996. p. 21. ISBN 978-0-87170-377-4. OCLC 21034891.
- ^ Pearson, S. (1975). «Initiation of fatigue cracks in commercial aluminum alloys and the subsequent propagation of very short cracks». Engineering Fracture Mechanics. 7 (2): 235–247. doi:10.1016/0013-7944(75)90004-1.
- ^ Sunder, R.; Seetharam, S. A.; Bhaskaran, T. A. (1984). «Cycle counting for fatigue crack growth analysis». International Journal of Fatigue. 6 (3): 147–156. doi:10.1016/0142-1123(84)90032-X.
- ^ Udomphol, T. (2007). «Fatigue of metals» (PDF). Suranaree University of Technology. p. 54. Archived from the original (PDF) on 2013-01-02. Retrieved 2013-01-26.
- ^ Lincoln, J. W. (1985). «Risk assessment of an aging military aircraft». Journal of Aircraft. 22 (8): 687–691. doi:10.2514/3.45187.
- ^ «Material Technologies, Inc. Completes EFS Inspection of Bridge in New Jersey» (Press release). Material Technologies. 17 April 2007.
- ^ «High Interference Bushing Installation». Fatigue Technology. Retrieved 24 June 2019.
- ^ Baker, Alan (2008). Structural Health Monitoring of a Bonded composite Patch Repair on a Fatigue-Cracked F-111C Wing (PDF). Defence Science and Technology Organisation. Archived (PDF) from the original on June 24, 2019. Retrieved 24 June 2019.
- ^ Hoffer, W. (June 1989). «Horrors in the Skies». Popular Mechanics. 166 (6): 67–70, 115–117.
- ^ Can Yildirim, H.; Marquis, G. B. (2012). «Fatigue strength improvement factors for high strength steel welded joints treated by high frequency mechanical impact». International Journal of Fatigue. 44: 168–176. doi:10.1016/j.ijfatigue.2012.05.002.
- ^ Can Yildirim, H.; Marquis, G. B.; Barsoum, Z. (2013). «Fatigue assessment of High Frequency Mechanical Impact (HFMI)-improved fillet welds by local approaches». International Journal of Fatigue. 52: 57–67. doi:10.1016/j.ijfatigue.2013.02.014.
- ^ «Cold work bush installation». Fatigue Technology. Archived from the original on 2019-09-02. Retrieved 20 July 2019.
- ^ «Research (Laser Peening)». LAMPL.
- ^ «Search Results for ‘fatigue’«. Cryogenic Treatment Database.
- ^ «Airframe Life Extension by Optimised Shape Reworking» (PDF). Retrieved 24 June 2019.
- ^ Tetelman, A. S. (1969). «Fracture Processes in Fiber Composite Materials». Composite Materials: Testing and Design. astm.org. doi:10.1520/STP49836S. ISBN 978-0-8031-0017-6. Retrieved 2022-05-20.
- ^ a b Corten, H. T. (1972). Composite Materials: Testing and Design : a Conference. ASTM International. ISBN 978-0-8031-0134-0.
- ^ Rotem, A.; Nelson, H. G. (1989-01-01). «Failure of a laminated composite under tension—compression fatigue loading». Composites Science and Technology. 36 (1): 45–62. doi:10.1016/0266-3538(89)90015-8. ISSN 0266-3538.
- ^ Courtney, Thomas H. (2005-12-16). Mechanical Behavior of Materials: Second Edition. Waveland Press. ISBN 978-1-4786-0838-7.
- ^ «ObjectWiki: Fuselage of de Havilland Comet Airliner G-ALYP». Science Museum. 24 September 2009. Archived from the original on 7 January 2009. Retrieved 9 October 2009.
- ^ The Alexander L. Kielland accident, Report of a Norwegian public commission appointed by royal decree of March 28, 1980, presented to the Ministry of Justice and Police March. Norwegian Public Reports 1981:11. Norwegian Ministry of Justice and Public Security. 1981. ASIN B0000ED27N.
- ^ Redmond, Gerard. «From ‘Safe Life’ to Fracture Mechanics — F111 Aircraft Cold Temperature Proof Testing at RAAF Amberley». Retrieved 17 April 2019.
- ^ Ansberry, C. (5 February 2001). «In Firestone Tire Study, Expert Finds Vehicle Weight Was Key in Failure». Wall Street Journal. Retrieved 6 September 2016.
Further reading[edit]
- PDL Staff (1995). Fatigue and Tribological Properties of Plastics and Elastomers. Plastics Design Library. ISBN 978-1-884207-15-0.
- Leary, M.; Burvill, C. (2009). «Applicability of published data for fatigue-limited design». Quality and Reliability Engineering International. 25 (8): 921–932. doi:10.1002/qre.1010. S2CID 206432498.
- Dieter, G. E. (2013). Mechanical Metallurgy. McGraw-Hill. ISBN 978-1259064791.
- Little, R.E.; Jebe, E.H. (1975). Statistical Design of Fatigue Experiments. John Wiley & Sons. ISBN 978-0-470-54115-9.
- Schijve, J. (2009). Fatigue of Structures and Materials. Springer. ISBN 978-1-4020-6807-2.
- Lalanne, C. (2009). Fatigue Damage. ISTE — Wiley. ISBN 978-1-84821-125-4.
- Pook, L. (2007). Metal Fatigue, What it is, Why it matters. Springer. ISBN 978-1-4020-5596-6.
- Draper, J. (2008). Modern Metal Fatigue Analysis. EMAS. ISBN 978-0-947817-79-4.
- Suresh, S. (2004). Fatigue of Materials. Cambridge University Press. ISBN 978-0-521-57046-6.
- Kim, H. S. (2018). Mechanics of Solids and Fracture, 3rd ed. Bookboon, London. ISBN 978-87-403-2393-1.
External links[edit]
- Fatigue Shawn M. Kelly
- Application note on fatigue crack propagation in UHMWPE Archived 2013-11-04 at the Wayback Machine
- fatigue test video Karlsruhe University of Applied Sciences
- Strain life method G. Glinka
- Fatigue from variable amplitude loading A. Fatemi
Fracture of an aluminium crank arm. Dark area of striations: slow crack growth. Bright granular area: sudden fracture.
In materials science, fatigue is the initiation and propagation of cracks in a material due to cyclic loading. Once a fatigue crack has initiated, it grows a small amount with each loading cycle, typically producing striations on some parts of the fracture surface. The crack will continue to grow until it reaches a critical size, which occurs when the stress intensity factor of the crack exceeds the fracture toughness of the material, producing rapid propagation and typically complete fracture of the structure.
Fatigue has traditionally been associated with the failure of metal components which led to the term metal fatigue. In the nineteenth century, the sudden failing of metal railway axles was thought to be caused by the metal crystallising because of the brittle appearance of the fracture surface, but this has since been disproved.[1] Most materials, such as composites, plastics and ceramics, seem to experience some sort of fatigue-related failure.[2]
To aid in predicting the fatigue life of a component, fatigue tests are carried out using coupons to measure the rate of crack growth by applying constant amplitude cyclic loading and averaging the measured growth of a crack over thousands of cycles. However, there are also a number of special cases that need to be considered where the rate of crack growth is significantly different compared to that obtained from constant amplitude testing. Such as the reduced rate of growth that occurs for small loads near the threshold or after the application of an overload; and the increased rate of crack growth associated with short cracks or after the application of an underload.[2]
If the loads are above a certain threshold, microscopic cracks will begin to initiate at stress concentrations such as holes, persistent slip bands (PSBs), composite interfaces or grain boundaries in metals.[3] The stress values that cause fatigue damage are typically much less than the yield strength of the material.
Stages of fatigue[edit]
Historically, fatigue has been separated into regions of high cycle fatigue that require more than 104 cycles to failure where stress is low and primarily elastic and low cycle fatigue where there is significant plasticity. Experiments have shown that low cycle fatigue is also crack growth.[4]
Fatigue failures, both for high and low cycles, all follow the same basic steps: crack initiation, crack growth stages I and II, and finally ultimate failure. To begin the process, cracks must nucleate within a material. This process can occur either at stress risers in metallic samples or at areas with a high void density in polymer samples. These cracks propagate slowly at first during stage I crack growth along crystallographic planes, where shear stresses are highest. Once the cracks reach a critical size they propagate quickly during stage II crack growth in a direction perpendicular to the applied force. These cracks can eventually lead to the ultimate failure of the material, often in a brittle catastrophic fashion.
Crack initiation[edit]
The formation of initial cracks preceding fatigue failure is a separate process consisting of four discrete steps in metallic samples. The material will develop cell structures and harden in response to the applied load. This causes the amplitude of the applied stress to increase given the new restraints on strain. These newly formed cell structures will eventually break down with the formation of persistent slip bands (PSBs). Slip in the material is localized at these PSBs, and the exaggerated slip can now serve as a stress concentrator for a crack to form. Nucleation and growth of a crack to a detectable size accounts for most of the cracking process. It is for this reason that cyclic fatigue failures seem to occur so suddenly where the bulk of the changes in the material are not visible without destructive testing. Even in normally ductile materials, fatigue failures will resemble sudden brittle failures.
PSB-induced slip planes result in intrusions and extrusions along the surface of a material, often occurring in pairs.[5] This slip is not a microstructural change within the material, but rather a propagation of dislocations within the material. Instead of a smooth interface, the intrusions and extrusions will cause the surface of the material to resemble the edge of a deck of cards, where not all cards are perfectly aligned. Slip-induced intrusions and extrusions create extremely fine surface structures on the material. With surface structure size inversely related to stress concentration factors, PSB-induced surface slip can cause fractures to initiate.
These steps can also be bypassed entirely if the cracks form at a pre-existing stress concentrator such as from an inclusion in the material or from a geometric stress concentrator caused by a sharp internal corner or fillet.
Crack growth[edit]
Most of the fatigue life is generally consumed in the crack growth phase. The rate of growth is primarily driven by the range of cyclic loading although additional factors such as mean stress, environment, overloads and underloads can also affect the rate of growth. Crack growth may stop if the loads are small enough to fall below a critical threshold.
Fatigue cracks can grow from material or manufacturing defects from as small as 10 μm.
When the rate of growth becomes large enough, fatigue striations can be seen on the fracture surface. Striations mark the position of the crack tip and the width of each striation represents the growth from one loading cycle. Striations are a result of plasticity at the crack tip.
When the stress intensity exceeds a critical value known as the fracture toughness, unsustainable fast fracture will occur, usually by a process of microvoid coalescence. Prior to final fracture, the fracture surface may contain a mixture of areas of fatigue and fast fracture.
Acceleration and retardation[edit]
The following effects change the rate of growth:[2]
- Mean stress effect: Higher mean stress increases the rate of crack growth.
- Environment: Increased moisture increases the rate of crack growth. In the case of aluminium, cracks generally grow from the surface, where water vapour from the atmosphere is able to reach the tip of the crack and dissociate into atomic hydrogen which causes hydrogen embrittlement. Cracks growing internally are isolated from the atmosphere and grow in a vacuum where the rate of growth is typically an order of magnitude slower than a surface crack.[6]
- Short crack effect: In 1975, Pearson observed that short cracks grow faster than expected.[7] Possible reasons for the short crack effect include the presence of the T-stress, the tri-axial stress state at the crack tip, the lack of crack closure associated with short cracks and the large plastic zone in comparison to the crack length. In addition, long cracks typically experience a threshold which short cracks do not have.[8] There are a number of criteria for short cracks:[9]
- cracks are typically smaller than 1 mm,
- cracks are smaller than the material microstructure size such as the grain size, or
- crack length is small compared to the plastic zone.
- Underloads: Small numbers of underloads increase the rate of growth and may counteract the effect of overloads.
- Overloads: Initially overloads (> 1.5 the maximum load in a sequence) lead to a small increase in the rate of growth followed by a long reduction in the rate of growth.
Characteristics of fatigue[edit]
- In metal alloys, and for the simplifying case when there are no macroscopic or microscopic discontinuities, the process starts with dislocation movements at the microscopic level, which eventually form persistent slip bands that become the nucleus of short cracks.
- Macroscopic and microscopic discontinuities (at the crystalline grain scale) as well as component design features which cause stress concentrations (holes, keyways, sharp changes of load direction etc.) are common locations at which the fatigue process begins.
- Fatigue is a process that has a degree of randomness (stochastic), often showing considerable scatter even in seemingly identical samples in well controlled environments.
- Fatigue is usually associated with tensile stresses but fatigue cracks have been reported due to compressive loads.[10]
- The greater the applied stress range, the shorter the life.
- Fatigue life scatter tends to increase for longer fatigue lives.
- Damage is irreversible. Materials do not recover when rested.
- Fatigue life is influenced by a variety of factors, such as temperature, surface finish, metallurgical microstructure, presence of oxidizing or inert chemicals, residual stresses, scuffing contact (fretting), etc.
- Some materials (e.g., some steel and titanium alloys) exhibit a theoretical fatigue limit below which continued loading does not lead to fatigue failure.
- High cycle fatigue strength (about 104 to 108 cycles) can be described by stress-based parameters. A load-controlled servo-hydraulic test rig is commonly used in these tests, with frequencies of around 20–50 Hz. Other sorts of machines—like resonant magnetic machines—can also be used, to achieve frequencies up to 250 Hz.
- Low-cycle fatigue (loading that typically causes failure in less than 104 cycles) is associated with localized plastic behavior in metals; thus, a strain-based parameter should be used for fatigue life prediction in metals. Testing is conducted with constant strain amplitudes typically at 0.01–5 Hz.
Timeline of research history[edit]
Micrographs showing how surface fatigue cracks grow as material is further cycled. From Ewing & Humfrey, 1903
- 1837: Wilhelm Albert publishes the first article on fatigue. He devised a test machine for conveyor chains used in the Clausthal mines.[11]
- 1839: Jean-Victor Poncelet describes metals as being ‘tired’ in his lectures at the military school at Metz.
- 1842: William John Macquorn Rankine recognises the importance of stress concentrations in his investigation of railroad axle failures. The Versailles train wreck was caused by fatigue failure of a locomotive axle.[12]
- 1843: Joseph Glynn reports on the fatigue of an axle on a locomotive tender. He identifies the keyway as the crack origin.
- 1848: The Railway Inspectorate reports one of the first tyre failures, probably from a rivet hole in tread of railway carriage wheel. It was likely a fatigue failure.
- 1849: Eaton Hodgkinson is granted a «small sum of money» to report to the UK Parliament on his work in «ascertaining by direct experiment, the effects of continued changes of load upon iron structures and to what extent they could be loaded without danger to their ultimate security».
- 1854: F. Braithwaite reports on common service fatigue failures and coins the term fatigue.[13]
- 1860: Systematic fatigue testing undertaken by Sir William Fairbairn and August Wöhler.
- 1870: A. Wöhler summarises his work on railroad axles. He concludes that cyclic stress range is more important than peak stress and introduces the concept of endurance limit.[11]
- 1903: Sir James Alfred Ewing demonstrates the origin of fatigue failure in microscopic cracks.
- 1910: O. H. Basquin proposes a log-log relationship for S-N curves, using Wöhler’s test data.[14]
- 1940: Sidney M. Cadwell publishes first rigorous study of fatigue in rubber.[15]
- 1945: A. M. Miner popularises Palmgren’s (1924) linear damage hypothesis as a practical design tool.[16][17]
- 1952: W. Weibull An S-N curve model.[18]
- 1954: The world’s first commercial jetliner, the de Havilland Comet, suffers disaster as three planes break up in mid-air, causing de Havilland and all other manufacturers to redesign high altitude aircraft and in particular replace square apertures like windows with oval ones.
- 1954: L. F. Coffin and S. S. Manson explain fatigue crack-growth in terms of plastic strain in the tip of cracks.
- 1961: P. C. Paris proposes methods for predicting the rate of growth of individual fatigue cracks in the face of initial scepticism and popular defence of Miner’s phenomenological approach.
- 1968: Tatsuo Endo and M. Matsuishi devise the rainflow-counting algorithm and enable the reliable application of Miner’s rule to random loadings.[19]
- 1970: W. Elber elucidates the mechanisms and importance of crack closure in slowing the growth of a fatigue crack due to the wedging effect of plastic deformation left behind the tip of the crack.[20][21]
- 1973: M. W. Brown and K. J. Miller observe that fatigue life under multiaxial conditions is governed by the experience of the plane receiving the most damage, and that both tension and shear loads on the critical plane must be considered.[22]
Predicting fatigue life[edit]
The American Society for Testing and Materials defines fatigue life, Nf, as the number of stress cycles of a specified character that a specimen sustains before failure of a specified nature occurs.[23] For some materials, notably steel and titanium, there is a theoretical value for stress amplitude below which the material will not fail for any number of cycles, called a fatigue limit or endurance limit.[24] However, in practice, several bodies of work done at greater numbers of cycles suggest that fatigue limits do not exist for any metals.[25][26][27]
Engineers have used a number of methods to determine the fatigue life of a material:[28]
- the stress-life method,
- the strain-life method,
- the crack growth method and
- probabilistic methods, which can be based on either life or crack growth methods.
Whether using stress/strain-life approach or using crack growth approach, complex or variable amplitude loading is reduced to a series of fatigue equivalent simple cyclic loadings using a technique such as the rainflow-counting algorithm.
Stress-life and strain-life methods[edit]
A mechanical part is often exposed to a complex, often random, sequence of loads, large and small. In order to assess the safe life of such a part using the fatigue damage or stress/strain-life methods the following series of steps is usually performed:
- Complex loading is reduced to a series of simple cyclic loadings using a technique such as rainflow analysis;
- A histogram of cyclic stress is created from the rainflow analysis to form a fatigue damage spectrum;
- For each stress level, the degree of cumulative damage is calculated from the S-N curve; and
- The effect of the individual contributions are combined using an algorithm such as Miner’s rule.
Since S-N curves are typically generated for uniaxial loading, some equivalence rule is needed whenever the loading is multiaxial. For simple, proportional loading histories (lateral load in a constant ratio with the axial), Sines rule may be applied. For more complex situations, such as non-proportional loading, critical plane analysis must be applied.
Miner’s rule[edit]
In 1945, M.A. Miner popularised a rule that had first been proposed by A. Palmgren in 1924.[16] The rule, variously called Miner’s rule or the Palmgren-Miner linear damage hypothesis, states that where there are k different stress magnitudes in a spectrum, Si (1 ≤ i ≤ k), each contributing ni(Si) cycles, then if Ni(Si) is the number of cycles to failure of a constant stress reversal Si (determined by uni-axial fatigue tests), failure occurs when:
Usually, for design purposes, C is assumed to be 1. This can be thought of as assessing what proportion of life is consumed by a linear combination of stress reversals at varying magnitudes.
Although Miner’s rule may be a useful approximation in many circumstances, it has several major limitations:
- It fails to recognize the probabilistic nature of fatigue and there is no simple way to relate life predicted by the rule with the characteristics of a probability distribution. Industry analysts often use design curves, adjusted to account for scatter, to calculate Ni(Si).
- The sequence in which high vs. low stress cycles are applied to a sample in fact affect the fatigue life, for which Miner’s Rule does not account. In some circumstances, cycles of low stress followed by high stress cause more damage than would be predicted by the rule.[29] It does not consider the effect of an overload or high stress which may result in a compressive residual stress that may retard crack growth. High stress followed by low stress may have less damage due to the presence of compressive residual stress (or localized plastic damages around crack tip).
Stress-life (S-N) method[edit]
S-N curve for a brittle aluminium with an ultimate tensile strength of 320 MPa
Materials fatigue performance is commonly characterized by an S-N curve, also known as a Wöhler curve. This is often plotted with the cyclic stress (S) against the cycles to failure (N) on a logarithmic scale.[30] S-N curves are derived from tests on samples of the material to be characterized (often called coupons or specimens) where a regular sinusoidal stress is applied by a testing machine which also counts the number of cycles to failure. This process is sometimes known as coupon testing. For greater accuracy but lower generality component testing is used.[31] Each coupon or component test generates a point on the plot though in some cases there is a runout where the time to failure exceeds that available for the test (see censoring). Analysis of fatigue data requires techniques from statistics, especially survival analysis and linear regression.
The progression of the S-N curve can be influenced by many factors such as stress ratio (mean stress),[32] loading frequency, temperature, corrosion, residual stresses, and the presence of notches. A constant fatigue life (CFL) diagram[33] is useful for the study of stress ratio effect. The Goodman line is a method used to estimate the influence of the mean stress on the fatigue strength.
A Constant Fatigue Life (CFL) diagram is useful for stress ratio effect on S-N curve.[34] Also, in the presence of a steady stress superimposed on the cyclic loading, the Goodman relation can be used to estimate a failure condition. It plots stress amplitude against mean stress with the fatigue limit and the ultimate tensile strength of the material as the two extremes. Alternative failure criteria include Soderberg and Gerber.[35]
As coupons sampled from a homogeneous frame will display a variation in their number of cycles to failure, the S-N curve should more properly be a Stress-Cycle-Probability (S-N-P) curve to capture the probability of failure after a given number of cycles of a certain stress.
With body-centered cubic materials (bcc), the Wöhler curve often becomes a horizontal line with decreasing stress amplitude, i.e. there is a fatigue strength that can be assigned to these materials. With face-centered cubic metals (fcc), the Wöhler curve generally drops continuously, so that only a fatigue limit can be assigned to these materials.[36]
Strain-life (ε-N) method[edit]
Graph showing fatigue failure as a function of strain amplitude.
When strains are no longer elastic, such as in the presence of stress concentrations, the total strain can be used instead of stress as a similitude parameter. This is known as the strain-life method. The total strain amplitude is the sum of the elastic strain amplitude and the plastic strain amplitude and is given by[2][37]
-
- .
Basquin’s equation for the elastic strain amplitude is
where is Young’s modulus.
The relation for high cycle fatigue can be expressed using the elastic strain amplitude
where is a parameter that scales with tensile strength obtained by fitting experimental data, is the number of cycles to failure and is the slope of the log-log curve again determined by curve fitting.
In 1954, Coffin and Manson proposed that the fatigue life of a component was related to the plastic strain amplitude using
-
- .
Combining the elastic and plastic portions gives the total strain amplitude accounting for both low and high cycle fatigue
-
- .
where is the fatigue strength coefficient, is the fatigue strength exponent, is the fatigue ductility coefficient, is the fatigue ductility exponent, and is the number of cycles to failure ( being the number of reversals to failure).
Crack growth methods[edit]
An estimate of the fatigue life of a component can be made using a crack growth equation by summing up the width of each increment of crack growth for each loading cycle. Safety or scatter factors are applied to the calculated life to account for any uncertainty and variability associated with fatigue. The rate of growth used in crack growth predictions is typically measured by applying thousands of constant amplitude cycles to a coupon and measuring the rate of growth from the change in compliance of the coupon or by measuring the growth of the crack on the surface of the coupon. Standard methods for measuring the rate of growth have been developed by ASTM International.[9]
Crack growth equations such as the Paris–Erdoğan equation are used to predict the life of a component. They can be used to predict the growth of a crack from 10 um to failure. For normal manufacturing finishes this may cover most of the fatigue life of a component where growth can start from the first cycle.[4] The conditions at the crack tip of a component are usually related to the conditions of test coupon using a characterising parameter such as the stress intensity, J-integral or crack tip opening displacement. All these techniques aim to match the crack tip conditions on the component to that of test coupons which give the rate of crack growth.
Additional models may be necessary to include retardation and acceleration effects associated with overloads or underloads in the loading sequence. In addition, small crack growth data may be needed to match the increased rate of growth seen with small cracks.[38]
Typically, a cycle counting technique such as rainflow-cycle counting is used to extract the cycles from a complex sequence. This technique, along with others, has been shown to work with crack growth methods.[39]
Crack growth methods have the advantage that they can predict the intermediate size of cracks. This information can be used to schedule inspections on a structure to ensure safety whereas strain/life methods only give a life until failure.
Dealing with fatigue[edit]
Fracture surface in a glass rod showing beach marks surrounding the initiation site.
Design[edit]
Dependable design against fatigue-failure requires thorough education and supervised experience in structural engineering, mechanical engineering, or materials science. There are at least five principal approaches to life assurance for mechanical parts that display increasing degrees of sophistication:[40]
- Design to keep stress below threshold of fatigue limit (infinite lifetime concept);
- Fail-safe, graceful degradation, and fault-tolerant design: Instruct the user to replace parts when they fail. Design in such a way that there is no single point of failure, and so that when any one part completely fails, it does not lead to catastrophic failure of the entire system.
- Safe-life design: Design (conservatively) for a fixed life after which the user is instructed to replace the part with a new one (a so-called lifed part, finite lifetime concept, or «safe-life» design practice); planned obsolescence and disposable product are variants that design for a fixed life after which the user is instructed to replace the entire device;
- Damage tolerance: Is an approach that ensures aircraft safety by assuming the presence of cracks or defects even in new aircraft. Crack growth calculations, periodic inspections and component repair or replacement can be used to ensure critical components that may contain cracks, remain safe. Inspections usually use nondestructive testing to limit or monitor the size of possible cracks and require an accurate prediction of the rate of crack-growth between inspections. The designer sets some aircraft maintenance checks schedule frequent enough that parts are replaced while the crack is still in the «slow growth» phase. This is often referred to as damage tolerant design or «retirement-for-cause».
- Risk Management: Ensures the probability of failure remains below an acceptable level. This approach is typically used for aircraft where acceptable levels may be based on probability of failure during a single flight or taken over the lifetime of an aircraft. A component is assumed to have a crack with a probability distribution of crack sizes. This approach can consider variability in values such as crack growth rates, usage and critical crack size.[41] It is also useful for considering damage at multiple locations that may interact to produce multi-site or widespread fatigue damage. Probability distributions that are common in data analysis and in design against fatigue include the log-normal distribution, extreme value distribution, Birnbaum–Saunders distribution, and Weibull distribution.
Testing[edit]
Fatigue testing can be used for components such as a coupon or a full-scale test article to determine:
- the rate of crack growth and fatigue life of components such as a coupon or a full-scale test article.
- location of critical regions
- degree of fail-safety when part of the structure fails
- the origin and cause of the crack initiating defect from fractographic examination of the crack.
These tests may form part of the certification process such as for airworthiness certification.
Repair[edit]
- Stop drill Fatigue cracks that have begun to propagate can sometimes be stopped by drilling holes, called drill stops, at the tip of the crack.[42] The possibility remains of a new crack starting in the side of the hole.
- Blend. Small cracks can be blended away and the surface cold worked or shot peened.
- Oversize holes. Holes with cracks growing from them can be drilled out to a larger hole to remove cracking and bushed to restore the original hole. Bushes can be cold shrink Interference fit bushes to induce beneficial compressive residual stresses. The oversized hole can also be cold worked by drawing an oversized mandrel through the hole.[43]
- Patch. Cracks may be repaired by installing a patch or repair fitting. Composite patches have been used to restore the strength of aircraft wings after cracks have been detected or to lower the stress prior to cracking in order to improve the fatigue life.[44] Patches may restrict the ability to monitor fatigue cracks and may need to be removed and replaced for inspections.
Life improvement[edit]
Example of a HFMI treated steel highway bridge to avoid fatigue along the weld transition.
- Change material. Changes in the materials used in parts can also improve fatigue life. For example, parts can be made from better fatigue rated metals. Complete replacement and redesign of parts can also reduce if not eliminate fatigue problems. Thus helicopter rotor blades and propellers in metal are being replaced by composite equivalents. They are not only lighter, but also much more resistant to fatigue. They are more expensive, but the extra cost is amply repaid by their greater integrity, since loss of a rotor blade usually leads to total loss of the aircraft. A similar argument has been made for replacement of metal fuselages, wings and tails of aircraft.[45]
- Induce residual stresses Peening a surface can reduce such tensile stresses and create compressive residual stress, which prevents crack initiation. Forms of peening include: shot peening, using high-speed projectiles, high-frequency impact treatment (also called high-frequency mechanical impact) using a mechanical hammer,[46][47] and laser peening which uses high-energy laser pulses. Low plasticity burnishing can also be used to induce compresses stress in fillets and cold work mandrels can be used for holes.[48] Increases in fatigue life and strength are proportionally related to the depth of the compressive residual stresses imparted. Shot peening imparts compressive residual stresses approximately 0.005 inches (0.1 mm) deep, while laser peening can go 0.040 to 0.100 inches (1 to 2.5 mm) deep, or deeper.[49][failed verification]
- Deep cryogenic treatment. The use of Deep Cryogenic treatment has been shown to increase resistance to fatigue failure. Springs used in industry, auto racing and firearms have been shown to last up to six times longer when treated. Heat checking, which is a form of thermal cyclic fatigue has been greatly delayed.[50]
- Re-profiling. Changing the shape of a stress concentration such as a hole or cutout may be used to extend the life of a component. Shape optimisation using numerical optimisation algorithms have been used to lower the stress concentration in wings and increase their life.[51]
Fatigue of composites[edit]
Composite materials can offer excellent resistance to fatigue loading. In general, composites exhibit good fracture toughness and, unlike metals, increase fracture toughness with increasing strength. The critical damage size in composites is also greater than that for metals.[52]
The primary mode of damage in a metal structure is cracking. For metal, cracks propagate in a relatively well-defined manner with respect to the applied stress, and the critical crack size and rate of crack propagation can be related to specimen data through analytical fracture mechanics. However, with composite structures, there is no single damage mode which dominates. Matrix cracking, delamination, debonding, voids, fiber fracture, and composite cracking can all occur separately and in combination, and the predominance of one or more is highly dependent on the laminate orientations and loading conditions.[53] In addition, the unique joints and attachments used for composite structures often introduce modes of failure different from those typified by the laminate itself.[54]
The composite damage propagates in a less regular manner and damage modes can change. Experience with composites indicates that the rate of damage propagation in does not exhibit the two distinct regions of initiation and propagation like metals. The crack initiation range in metals is propagation, and there is a significant quantitative difference in rate while the difference appears to be less apparent with composites.[53] Fatigue cracks of composites may form in the matrix and propagate slowly since the matrix carries such a small fraction of the applied stress. And the fibers in the wake of the crack experience fatigue damage. In many cases, the damage rate is accelerated by deleterious interactions with the environment like oxidation or corrosion of fibers.[55]
Notable fatigue failures[edit]
Versailles train crash[edit]
Versailles train disaster
Drawing of a fatigue failure in an axle by Joseph Glynn, 1843
Following the King Louis-Philippe I’s celebrations at the Palace of Versailles, a train returning to Paris crashed in May 1842 at Meudon after the leading locomotive broke an axle. The carriages behind piled into the wrecked engines and caught fire. At least 55 passengers were killed trapped in the locked carriages, including the explorer Jules Dumont d’Urville. This accident is known in France as the «Catastrophe ferroviaire de Meudon». The accident was witnessed by the British locomotive engineer Joseph Locke and widely reported in Britain. It was discussed extensively by engineers, who sought an explanation.
The derailment had been the result of a broken locomotive axle. Rankine’s investigation of broken axles in Britain highlighted the importance of stress concentration, and the mechanism of crack growth with repeated loading. His and other papers suggesting a crack growth mechanism through repeated stressing, however, were ignored, and fatigue failures occurred at an ever-increasing rate on the expanding railway system. Other spurious theories seemed to be more acceptable, such as the idea that the metal had somehow «crystallized». The notion was based on the crystalline appearance of the fast fracture region of the crack surface, but ignored the fact that the metal was already highly crystalline.
de Havilland Comet[edit]
The recovered (shaded) parts of the wreckage of G-ALYP and the site (arrowed) of the failure
Two de Havilland Comet passenger jets broke up in mid-air and crashed within a few months of each other in 1954. As a result, systematic tests were conducted on a fuselage immersed and pressurised in a water tank. After the equivalent of 3,000 flights, investigators at the Royal Aircraft Establishment (RAE) were able to conclude that the crash had been due to failure of the pressure cabin at the forward Automatic Direction Finder window in the roof. This ‘window’ was in fact one of two apertures for the aerials of an electronic navigation system in which opaque fibreglass panels took the place of the window ‘glass’. The failure was a result of metal fatigue caused by the repeated pressurisation and de-pressurisation of the aircraft cabin. Also, the supports around the windows were riveted, not bonded, as the original specifications for the aircraft had called for. The problem was exacerbated by the punch rivet construction technique employed. Unlike drill riveting, the imperfect nature of the hole created by punch riveting caused manufacturing defect cracks which may have caused the start of fatigue cracks around the rivet.
The fuselage roof fragment of G-ALYP on display in the Science Museum in London, showing the two ADF windows at which the initial failure occurred.[56]
The Comet’s pressure cabin had been designed to a safety factor comfortably in excess of that required by British Civil Airworthiness Requirements (2.5 times the cabin proof test pressure as opposed to the requirement of 1.33 times and an ultimate load of 2.0 times the cabin pressure) and the accident caused a revision in the estimates of the safe loading strength requirements of airliner pressure cabins.
In addition, it was discovered that the stresses around pressure cabin apertures were considerably higher than had been anticipated, especially around sharp-cornered cut-outs, such as windows. As a result, all future jet airliners would feature windows with rounded corners, greatly reducing the stress concentration. This was a noticeable distinguishing feature of all later models of the Comet. Investigators from the RAE told a public inquiry that the sharp corners near the Comets’ window openings acted as initiation sites for cracks. The skin of the aircraft was also too thin, and cracks from manufacturing stresses were present at the corners.
Alexander L. Kielland oil platform capsizing[edit]
Fractures on the right side of the Alexander L. Kielland rig
The Alexander L. Kielland was a Norwegian semi-submersible drilling rig that capsized whilst working in the Ekofisk oil field in March 1980, killing 123 people. The capsizing was the worst disaster in Norwegian waters since World War II. The rig, located approximately 320 km east of Dundee, Scotland, was owned by the Stavanger Drilling Company of Norway and was on hire to the United States company Phillips Petroleum at the time of the disaster. In driving rain and mist, early in the evening of 27 March 1980 more than 200 men were off duty in the accommodation on the Alexander L. Kielland. The wind was gusting to 40 knots with waves up to 12 m high. The rig had just been winched away from the Edda production platform. Minutes before 18:30 those on board felt a ‘sharp crack’ followed by ‘some kind of trembling’. Suddenly the rig heeled over 30° and then stabilised. Five of the six anchor cables had broken, with one remaining cable preventing the rig from capsizing. The list continued to increase and at 18:53 the remaining anchor cable snapped and the rig turned upside down.
A year later in March 1981, the investigative report[57] concluded that the rig collapsed owing to a fatigue crack in one of its six bracings (bracing D-6), which connected the collapsed D-leg to the rest of the rig. This was traced to a small 6 mm fillet weld which joined a non-load-bearing flange plate to this D-6 bracing. This flange plate held a sonar device used during drilling operations. The poor profile of the fillet weld contributed to a reduction in its fatigue strength. Further, the investigation found considerable amounts of lamellar tearing in the flange plate and cold cracks in the butt weld. Cold cracks in the welds, increased stress concentrations due to the weakened flange plate, the poor weld profile, and cyclical stresses (which would be common in the North Sea), seemed to collectively play a role in the rig’s collapse.
Others[edit]
- The 1862 Hartley Colliery Disaster was caused by the fracture of a steam engine beam and killed 204 people.
- The 1919 Boston Great Molasses Flood has been attributed to a fatigue failure.
- The 1948 Northwest Airlines Flight 421 crash due to fatigue failure in a wing spar root
- The 1957 «Mt. Pinatubo», presidential plane of Philippine President Ramon Magsaysay, crashed due to engine failure caused by metal fatigue.
- The 1965 capsize of the UK’s first offshore oil platform, the Sea Gem, was due to fatigue in part of the suspension system linking the hull to the legs.
- The 1968 Los Angeles Airways Flight 417 lost one of its main rotor blades due to fatigue failure.
- The 1968 MacRobertson Miller Airlines Flight 1750 lost a wing due to improper maintenance leading to fatigue failure.
- The 1969 F-111A crash due to a fatigue failure of the wing pivot fitting from a material defect resulted in the development of the damage- tolerant approach for fatigue design.[58]
- The 1977 Dan-Air Boeing 707 crash caused by fatigue failure resulting in the loss of the right horizontal stabilizer.
- The 1979 American Airlines Flight 191 crashed after engine separation attributed to fatigue damage in the pylon structure holding the engine to the wing, caused by improper maintenance procedures.
- The 1980 LOT Flight 7 crashed due to fatigue in an engine turbine shaft resulting in engine disintegration leading to loss of control.
- The 1985 Japan Airlines Flight 123 crashed after the aircraft lost its vertical stabilizer due to faulty repairs on the rear bulkhead.
- The 1988 Aloha Airlines Flight 243 suffered an explosive decompression at 24,000 feet (7,300 m) after a fatigue failure.
- The 1989 United Airlines Flight 232 lost its tail engine due to fatigue failure in a fan disk hub.
- The 1992 El Al Flight 1862 lost both engines on its right-wing due to fatigue failure in the pylon mounting of the #3 Engine.
- The 1998 Eschede train disaster was caused by fatigue failure of a single composite wheel.
- The 2000 Hatfield rail crash was likely caused by rolling contact fatigue.
- The 2000 recall of 6.5 million Firestone tires on Ford Explorers originated from fatigue crack growth leading to separation of the tread from the tire.[59]
- The 2002 China Airlines Flight 611 disintegrated in-flight due to fatigue failure.
- The 2005 Chalk’s Ocean Airways Flight 101 lost its right wing due to fatigue failure brought about by inadequate maintenance practices.
- The 2009 Viareggio train derailment due to fatigue failure.
- The 2009 Sayano–Shushenskaya power station accident due to metal fatigue of turbine mountings.
- The 2017 Air France Flight 66 had in-flight engine failure due to cold dwell fatigue fracture in the fan hub.
See also[edit]
- Aviation safety – State in which risks associated with aviation are at an acceptable level
- Critical plane analysis – Analysis of multiaxial stresses and strains
- Embedment
- Forensic materials engineering – branch of forensic engineering
- Fractography – Study of the fracture surfaces of materials
- Solder fatigue – Degradation of solder due to deformation under cyclic loading
- Thermo-mechanical fatigue
- Vibration fatigue
- International Journal of Fatigue
References[edit]
- ^ Schijve, J. (2003). «Fatigue of structures and materials in the 20th century and the state of the art». International Journal of Fatigue. 25 (8): 679–702. doi:10.1016/S0142-1123(03)00051-3.
- ^ a b c d Suresh, S. (2004). Fatigue of Materials. Cambridge University Press. ISBN 978-0-521-57046-6.
- ^ Kim, W. H.; Laird, C. (1978). «Crack nucleation and stage I propagation in high strain fatigue—II. mechanism». Acta Metallurgica. 26 (5): 789–799. doi:10.1016/0001-6160(78)90029-9.
- ^ a b Murakami, Y.; Miller, K. J. (2005). «What is fatigue damage? A view point from the observation of low cycle fatigue process». International Journal of Fatigue. 27 (8): 991–1005. doi:10.1016/j.ijfatigue.2004.10.009.
- ^ Forsythe, P. J. E. (1953). «Exudation of material from slip bands at the surface of fatigued crystals of an aluminium-copper alloy». Nature. 171 (4343): 172–173. Bibcode:1953Natur.171..172F. doi:10.1038/171172a0. S2CID 4268548.
- ^ Schijve, J. (1978). «Internal fatigue cracks are growing in vacuum». Engineering Fracture Mechanics. 10 (2): 359–370. doi:10.1016/0013-7944(78)90017-6.
- ^ Pearson, S. (1975). «Initiation of fatigue cracks in commercial aluminium alloys and the subsequent propagation of very short cracks». Engineering Fracture Mechanics. 7 (2): 235–247. doi:10.1016/0013-7944(75)90004-1.
- ^ Pippan, R.; Hohenwarter, A. (2017). «Fatigue crack closure: a review of the physical phenomena». Fatigue & Fracture of Engineering Materials & Structures. 40 (4): 471–495. doi:10.1111/ffe.12578. PMC 5445565. PMID 28616624.
- ^ a b ASTM Committee E08.06 (2013). E647 Standard Test Method for Measurement of Fatigue Crack Growth Rates (Technical report). ASTM International. E647-13.
- ^ Fleck, N. A.; Shin, C. S.; Smith, R.A. (1985). «Fatigue Crack Growth Under Compressive Loading». Engineering Fracture Mechanics. 21 (1): 173–185. doi:10.1016/0013-7944(85)90063-3.
- ^ a b Schutz, W. (1996). «A history of fatigue». Engineering Fracture Mechanics. 54 (2): 263–300. doi:10.1016/0013-7944(95)00178-6.
- ^ Rankine, W. J. M. (1843). «On the causes of the unexpected breakage of the journals of railway axles, and on the means of preventing such accidents by observing the law of continuity in their construction». Minutes of the Proceedings of the Institution of Civil Engineers. 2 (1843): 105–107. doi:10.1680/imotp.1843.24600.
- ^ Braithwaite, F. (1854). «On the fatigue and consequent fracture of metals». Minutes of the Proceedings of the Institution of Civil Engineers. 13 (1854): 463–467. doi:10.1680/imotp.1854.23960.
- ^ Basquin, O. H. (1910). «The exponential law of endurance test». Proceedings of the American Society for Testing and Materials. 10: 625–630.
- ^ Cadwell, Sidney; Merrill; Sloman; Yost (1940). «Dynamic fatigue life of rubber». Rubber Chemistry and Technology. 13 (2): 304–315. doi:10.5254/1.3539515.
- ^ a b Miner, M. A. (1945). «Cumulative damage in fatigue». Journal of Applied Mechanics. 12: 149–164.
- ^ Palmgren, A. G. (1924). «Die Lebensdauer von Kugellagern» [Life Length of Roller Bearings]. Zeitschrift des Vereines Deutscher Ingenieure (in German). 68 (14): 339–341.
- ^ Murray, W.M., ed. (1952). «The statistical aspect of fatigue failure and its consequences». Fatigue and Fracture of Metals. Technology Press of the Massachusetts Institute of Technology/Wiley. pp. 182–196.
- ^ Matsuishi, M.; Endo, T. (1968). Fatigue of Metals Subjected to Varying Stress. Japan Society of Mechanical Engineers.
- ^ Elber, Wolf (1970). «Fatigue crack closure under cyclic tension». Engineering Fracture Mechanics. 2: 37–45.
- ^ Elber, Wolf (1971). The Significance of Fatigue Crack Closure, ASTM STP 486. American Society for Testing and Materials. pp. 230–243.
- ^ Brown, M. W.; Miller, K. J. (1973). «A theory for fatigue failure under multiaxial stress-strain conditions». Proceedings of the Institution of Mechanical Engineers. 187 (1): 745–755. doi:10.1243/PIME_PROC_1973_187_161_02.
- ^ Stephens, R. I.; Fuchs, H. O. (2001). Metal Fatigue in Engineering (2nd ed.). John Wiley & Sons. p. 69. ISBN 978-0-471-51059-8.
- ^ Bathias, C. (1999). «There is no infinite fatigue life in metallic materials». Fatigue & Fracture of Engineering Materials & Structures. 22 (7): 559–565. doi:10.1046/j.1460-2695.1999.00183.x.
- ^ Pyttel, B.; Schwerdt, D.; Berger, C. (2011-01-01). «Very high cycle fatigue – Is there a fatigue limit?». International Journal of Fatigue. Advances in Very High Cycle Fatigue. 33 (1): 49–58. doi:10.1016/j.ijfatigue.2010.05.009. ISSN 0142-1123.
- ^ Sonsino, C (December 2007). «Course of SN-curves especially in the high-cycle fatigue regime with regard to component design and safety». International Journal of Fatigue. 29 (12): 2246–2258. doi:10.1016/j.ijfatigue.2006.11.015.
- ^ Mughrabi, H. (2002). «On ‘multi-stage’ fatigue life diagrams and the relevant life-controlling mechanisms in ultrahigh-cycle fatigue». Fatigue & Fracture of Engineering Materials & Structures. 25 (8–9): 755–764. doi:10.1046/j.1460-2695.2002.00550.x. ISSN 1460-2695.
- ^ Shigley, J. E.; Mischke, C. R.; Budynas, R. G. (2003). Mechanical Engineering Design (7th ed.). McGraw Hill Higher Education. ISBN 978-0-07-252036-1.
- ^ Eskandari, H.; Kim, H. S. (2017). «A theory for mathematical framework and fatigue damage function for S-N plane». In Wei, Z.; Nikbin, K.; McKeighan, P. C.; Harlow, G. D. (eds.). Fatigue and Fracture Test Planning, Test Data Acquisitions and Analysis. ASTM Selected Technical Papers. Vol. 1598. pp. 299–336. doi:10.1520/STP159820150099. ISBN 978-0-8031-7639-3.
- ^ Burhan, Ibrahim; Kim, Ho Sung (September 2018). «S-N Curve Models for Composite Materials Characterisation: An Evaluative Review». Journal of Composites Science. 2 (3): 38–66. doi:10.3390/jcs2030038.
- ^ Weibull, Waloddi (1961). Fatigue testing and analysis of results. Oxford: Published for Advisory Group for Aeronautical Research and development, North Atlantic Treaty Organization, by Pergamon Press. ISBN 978-0-08-009397-0. OCLC 596184290.
- ^ Kim, Ho Sung (2019-01-01). «Prediction of S-N curves at various stress ratios for structural materials». Procedia Structural Integrity. Fatigue Design 2019, International Conference on Fatigue Design, 8th Edition. 19: 472–481. doi:10.1016/j.prostr.2019.12.051. ISSN 2452-3216.
- ^ Kawai, M.; Itoh, N. (2014). «A failure-mode based anisomorphic constant life diagram for a unidirectional carbon/epoxy laminate under off-axis fatigue loading at room temperature». Journal of Composite Materials. 48 (5): 571–592. Bibcode:2014JCoMa..48..571K. CiteSeerX 10.1.1.826.6050. doi:10.1177/0021998313476324. S2CID 137221135.
- ^ Kim, H. S. (2016). Mechanics of Solids and Fracture (2nd ed.). Ventus Publishing. ISBN 978-87-403-1395-6.
- ^ Beardmore, R. (13 January 2013). «Fatigue Stress Action Types». Roymechx. Archived from the original on 12 January 2017. Retrieved 29 April 2012.
- ^ tec-science (2018-07-13). «Fatigue test». tec-science. Retrieved 2019-10-25.
- ^ ASM Handbook, Volume 19 — Fatigue and Fracture. Materials Park, Ohio: ASM International. 1996. p. 21. ISBN 978-0-87170-377-4. OCLC 21034891.
- ^ Pearson, S. (1975). «Initiation of fatigue cracks in commercial aluminum alloys and the subsequent propagation of very short cracks». Engineering Fracture Mechanics. 7 (2): 235–247. doi:10.1016/0013-7944(75)90004-1.
- ^ Sunder, R.; Seetharam, S. A.; Bhaskaran, T. A. (1984). «Cycle counting for fatigue crack growth analysis». International Journal of Fatigue. 6 (3): 147–156. doi:10.1016/0142-1123(84)90032-X.
- ^ Udomphol, T. (2007). «Fatigue of metals» (PDF). Suranaree University of Technology. p. 54. Archived from the original (PDF) on 2013-01-02. Retrieved 2013-01-26.
- ^ Lincoln, J. W. (1985). «Risk assessment of an aging military aircraft». Journal of Aircraft. 22 (8): 687–691. doi:10.2514/3.45187.
- ^ «Material Technologies, Inc. Completes EFS Inspection of Bridge in New Jersey» (Press release). Material Technologies. 17 April 2007.
- ^ «High Interference Bushing Installation». Fatigue Technology. Retrieved 24 June 2019.
- ^ Baker, Alan (2008). Structural Health Monitoring of a Bonded composite Patch Repair on a Fatigue-Cracked F-111C Wing (PDF). Defence Science and Technology Organisation. Archived (PDF) from the original on June 24, 2019. Retrieved 24 June 2019.
- ^ Hoffer, W. (June 1989). «Horrors in the Skies». Popular Mechanics. 166 (6): 67–70, 115–117.
- ^ Can Yildirim, H.; Marquis, G. B. (2012). «Fatigue strength improvement factors for high strength steel welded joints treated by high frequency mechanical impact». International Journal of Fatigue. 44: 168–176. doi:10.1016/j.ijfatigue.2012.05.002.
- ^ Can Yildirim, H.; Marquis, G. B.; Barsoum, Z. (2013). «Fatigue assessment of High Frequency Mechanical Impact (HFMI)-improved fillet welds by local approaches». International Journal of Fatigue. 52: 57–67. doi:10.1016/j.ijfatigue.2013.02.014.
- ^ «Cold work bush installation». Fatigue Technology. Archived from the original on 2019-09-02. Retrieved 20 July 2019.
- ^ «Research (Laser Peening)». LAMPL.
- ^ «Search Results for ‘fatigue’«. Cryogenic Treatment Database.
- ^ «Airframe Life Extension by Optimised Shape Reworking» (PDF). Retrieved 24 June 2019.
- ^ Tetelman, A. S. (1969). «Fracture Processes in Fiber Composite Materials». Composite Materials: Testing and Design. astm.org. doi:10.1520/STP49836S. ISBN 978-0-8031-0017-6. Retrieved 2022-05-20.
- ^ a b Corten, H. T. (1972). Composite Materials: Testing and Design : a Conference. ASTM International. ISBN 978-0-8031-0134-0.
- ^ Rotem, A.; Nelson, H. G. (1989-01-01). «Failure of a laminated composite under tension—compression fatigue loading». Composites Science and Technology. 36 (1): 45–62. doi:10.1016/0266-3538(89)90015-8. ISSN 0266-3538.
- ^ Courtney, Thomas H. (2005-12-16). Mechanical Behavior of Materials: Second Edition. Waveland Press. ISBN 978-1-4786-0838-7.
- ^ «ObjectWiki: Fuselage of de Havilland Comet Airliner G-ALYP». Science Museum. 24 September 2009. Archived from the original on 7 January 2009. Retrieved 9 October 2009.
- ^ The Alexander L. Kielland accident, Report of a Norwegian public commission appointed by royal decree of March 28, 1980, presented to the Ministry of Justice and Police March. Norwegian Public Reports 1981:11. Norwegian Ministry of Justice and Public Security. 1981. ASIN B0000ED27N.
- ^ Redmond, Gerard. «From ‘Safe Life’ to Fracture Mechanics — F111 Aircraft Cold Temperature Proof Testing at RAAF Amberley». Retrieved 17 April 2019.
- ^ Ansberry, C. (5 February 2001). «In Firestone Tire Study, Expert Finds Vehicle Weight Was Key in Failure». Wall Street Journal. Retrieved 6 September 2016.
Further reading[edit]
- PDL Staff (1995). Fatigue and Tribological Properties of Plastics and Elastomers. Plastics Design Library. ISBN 978-1-884207-15-0.
- Leary, M.; Burvill, C. (2009). «Applicability of published data for fatigue-limited design». Quality and Reliability Engineering International. 25 (8): 921–932. doi:10.1002/qre.1010. S2CID 206432498.
- Dieter, G. E. (2013). Mechanical Metallurgy. McGraw-Hill. ISBN 978-1259064791.
- Little, R.E.; Jebe, E.H. (1975). Statistical Design of Fatigue Experiments. John Wiley & Sons. ISBN 978-0-470-54115-9.
- Schijve, J. (2009). Fatigue of Structures and Materials. Springer. ISBN 978-1-4020-6807-2.
- Lalanne, C. (2009). Fatigue Damage. ISTE — Wiley. ISBN 978-1-84821-125-4.
- Pook, L. (2007). Metal Fatigue, What it is, Why it matters. Springer. ISBN 978-1-4020-5596-6.
- Draper, J. (2008). Modern Metal Fatigue Analysis. EMAS. ISBN 978-0-947817-79-4.
- Suresh, S. (2004). Fatigue of Materials. Cambridge University Press. ISBN 978-0-521-57046-6.
- Kim, H. S. (2018). Mechanics of Solids and Fracture, 3rd ed. Bookboon, London. ISBN 978-87-403-2393-1.
External links[edit]
- Fatigue Shawn M. Kelly
- Application note on fatigue crack propagation in UHMWPE Archived 2013-11-04 at the Wayback Machine
- fatigue test video Karlsruhe University of Applied Sciences
- Strain life method G. Glinka
- Fatigue from variable amplitude loading A. Fatemi
Привет всем!
Последние записи были посвящены одному из этапов подготовки к зиме, а именно проверке тремя приборами аккумулятора и последующем восстановлении понесенных потерь заряда. Там же упоминалось, что это только увертюра к основному действию.
Неожиданно мы были прерваны на breaking news…
Пеня и впечатления потиху улеглись, возвращаемся к нашей теме.
Снял, аккумулятор, подзарядил в течение дня без фанатизма и всего-то делов прикрутить его назад…
Казалось бы, что тут может пойти не так? Тыщу раз снимал и ставил аккумулятор, при наличии инструмента делается одной левой… Однако, то ли усталость металла, то ли спешка, то ли мороз… Сломал!
Веселые ощущения, через 10 минут надо ехать, аккумулятор не закреплен… Закинул картонную коробку между батареей и воздушным, хоть как-то будет не позволять елозить. Хотя по словам СТО полгорода так и ездит 
Вся резьба болта осталась внутри аккумуляторной площадки… Тут уж пришлось узнать про экстракторы, их цену и доступность. Представляю залет, когда свеча подобным образом обламывается, жесть.
Но площадка-то не металлическая, и не просто пластик, а типа керамики хрупкий… При установке батареи кусачками подровнял за минуту бортик. Не уверен что метчиком можно взять такой материал.
Однако утро вечера мудренее, родилась мысль выкрутить обломок с обратной стороны площадки…
Для этого пришлось открутить чуть ли не дюжину аналогичных болтов со всех сторон, чтобы ее перевернуть.
Заодно нашелся «лишний» в качестве донора…
Картина маслом:
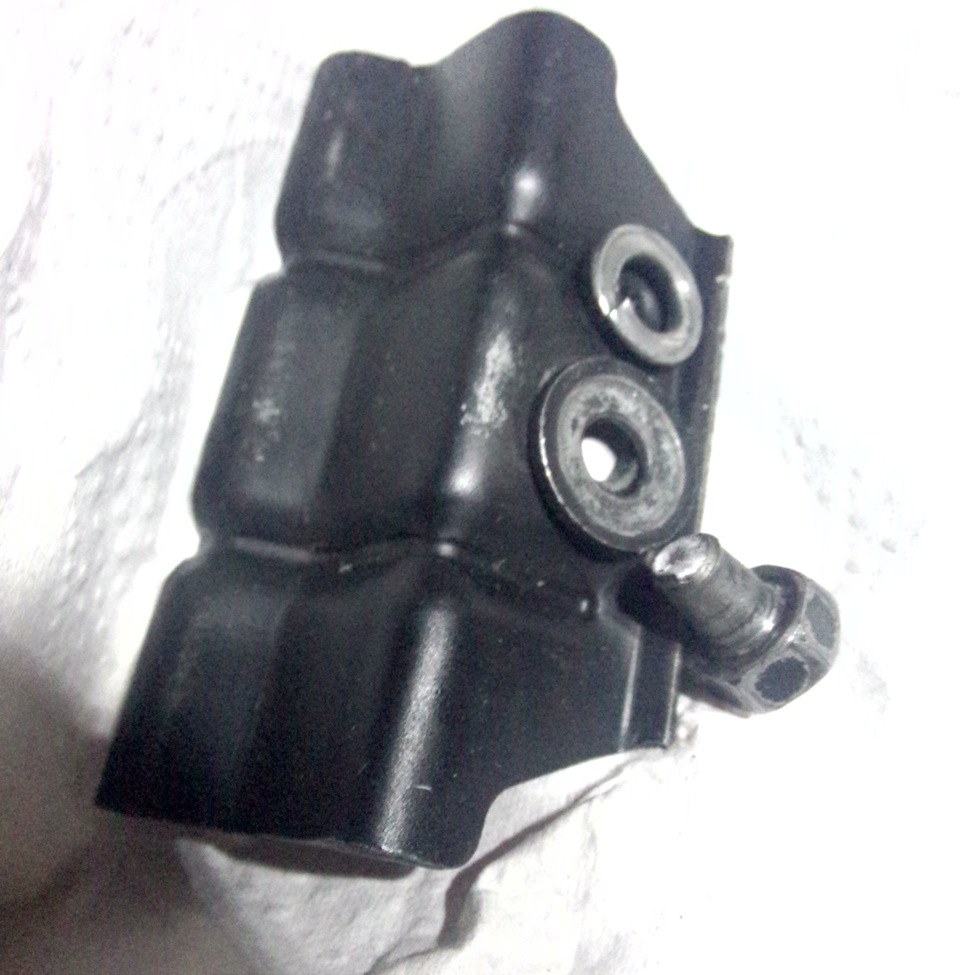
Полный размер
Закручивал не то что одной рукой, буквально одним пальцем и вот

Полный размер
Да, родной чехол маловат… Год пролежал отдельно, пытался всунуть, но не все так просто
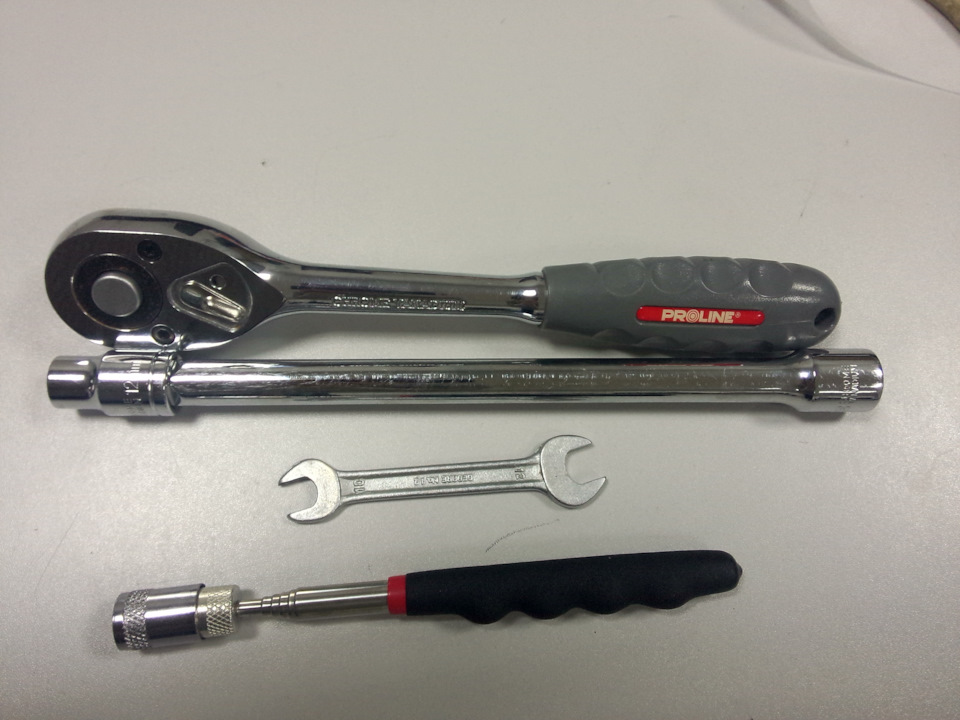
Полный размер
Действующие лица. Трещотка, удлинитель на 12, ключ на 10 и магнитная указка-фонарик
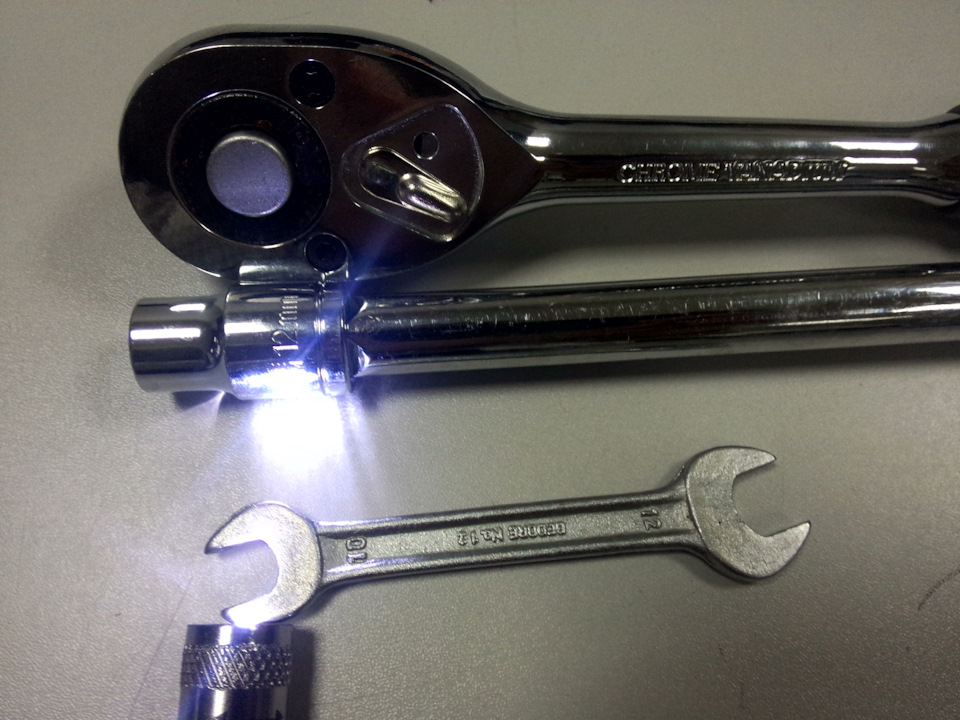
Полный размер
Подсветка и магнитная головка весьма пригодились
———————————————————————————————————————————————
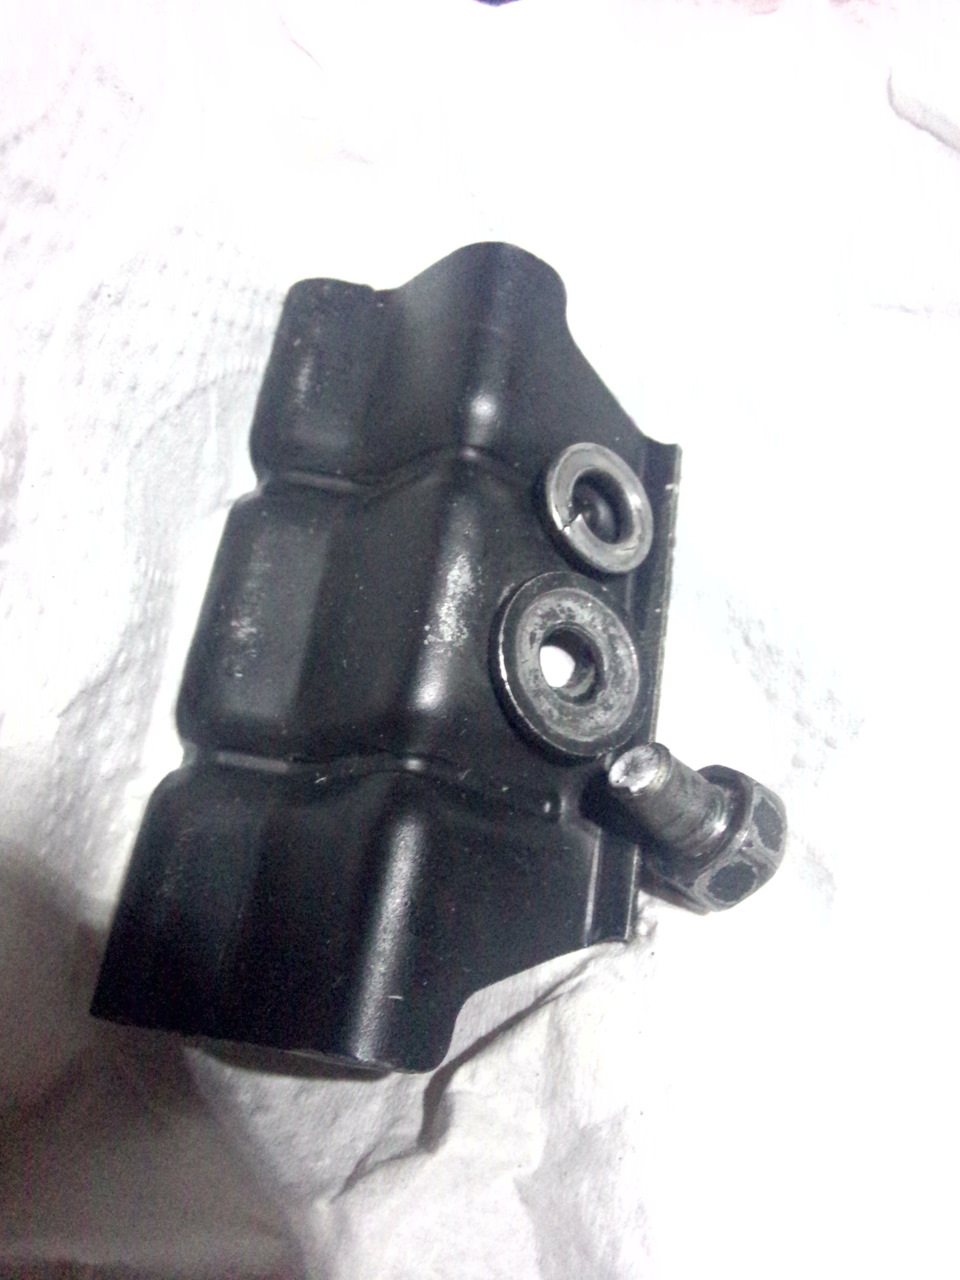
Полный размер
Ну вот как так?
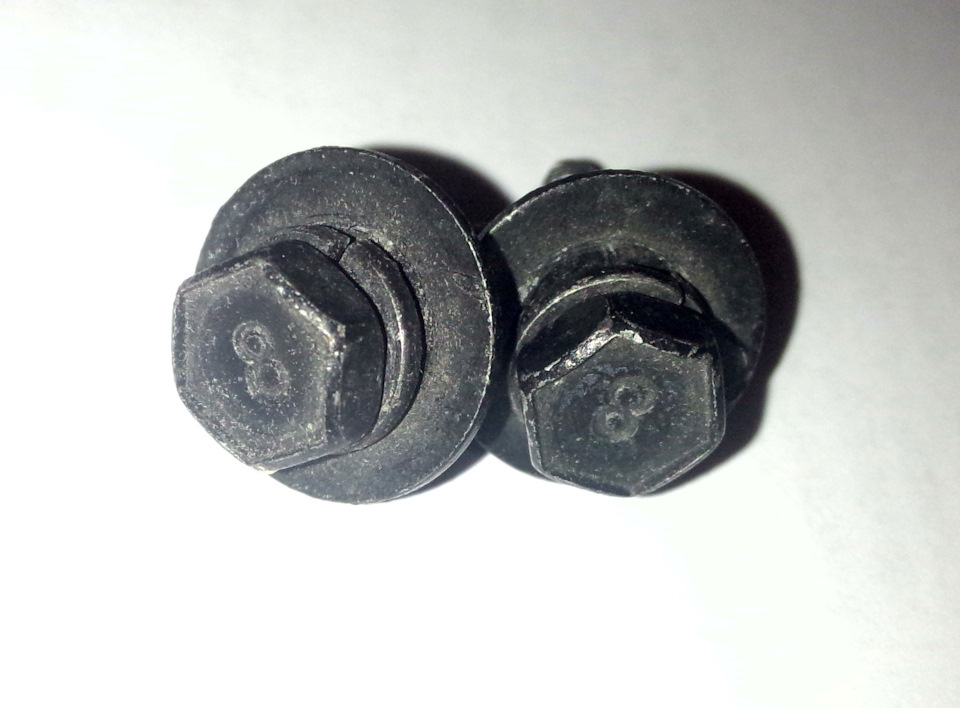
Полный размер
В загашнике валялись нульцевые
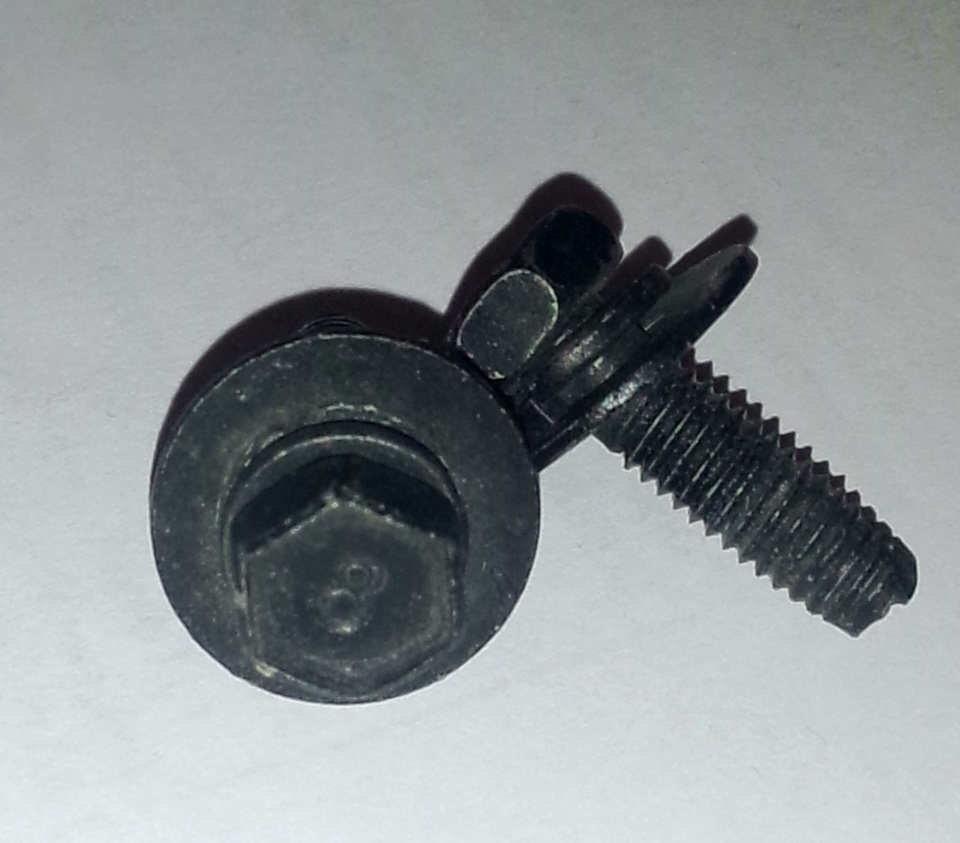
Полный размер
Но нет, естественно не подошли
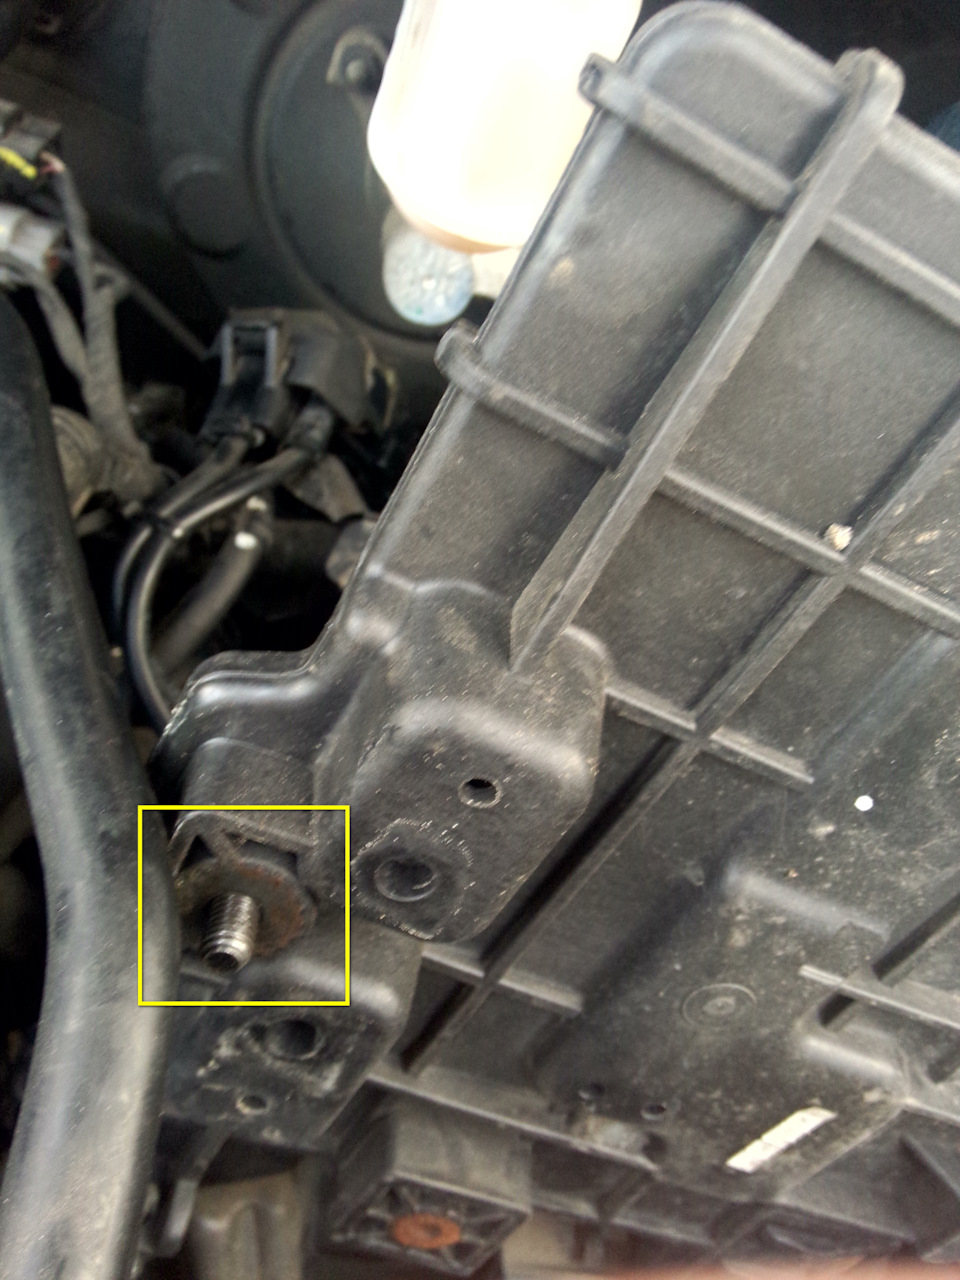
Полный размер
Кульминация. Желтым квадратом видим желаемое. Легко пальцами выкручиваем

Полный размер
Собираем назад, следуя закону, что одна деталька должна остаться лишней

Полный размер
Площадка армирована болтами

Полный размер
Зато отличный доступ
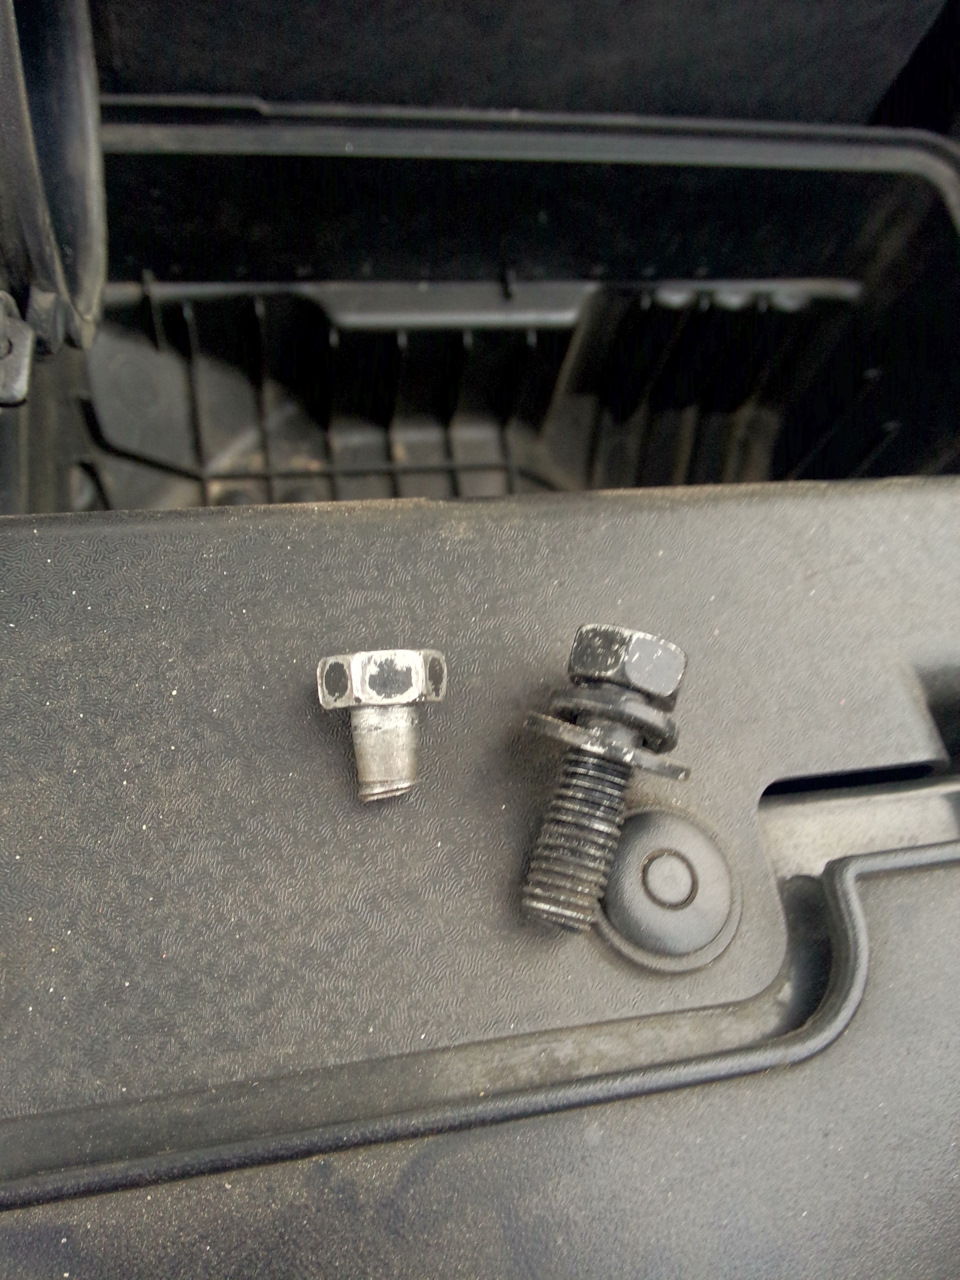
Полный размер
Донор определен. Виновник торжества слева, видно что устал
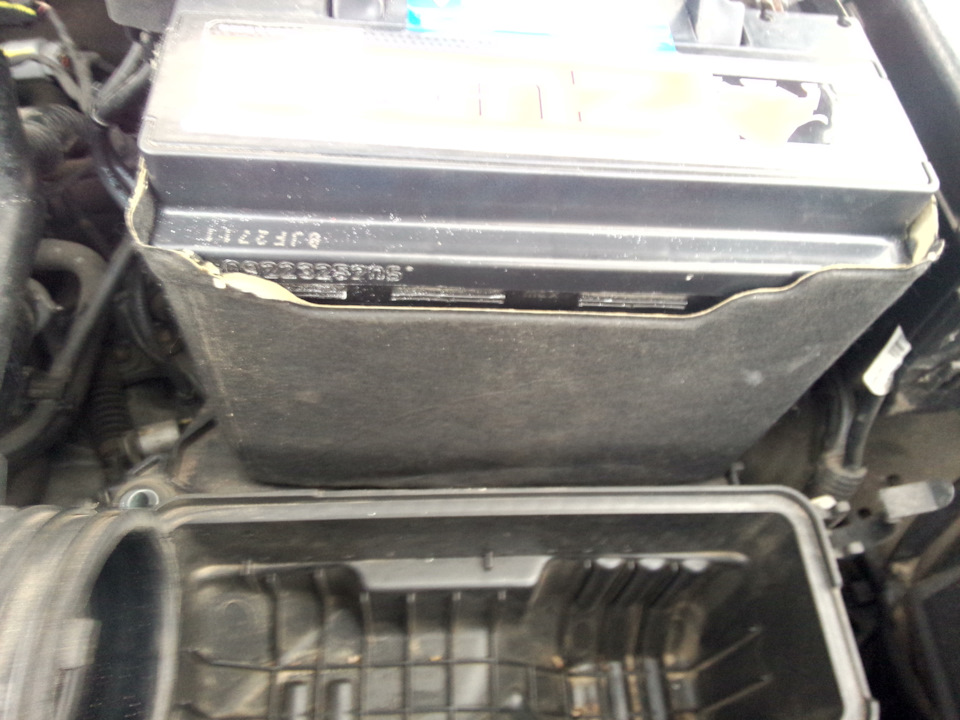
Полный размер
Раз уж все разобрали, пробуем впихнуть невпихуемое.
Полный размер
Таки делаем это.
Полный размер
Крепление надежно. Главное не захватывать им кожух.
———————————————————————————————————————————————
Полный размер
Без пылесоса никак… Салфетками оттирать практически невозможно

Полный размер
Раз пошла такая пьянка, режь последний огурец. Проверенный не раз RAF Filter RST281131R100.
Полный размер
Фильтр прошел всего 5 тыщ. с весны, однако с выходной стороны стал серый, значит пора менять
Снимаем фильтр, который фигурировал как новый в этой записи: Фильтр воздушный RAF Filter RST281131R100 в сравнении с оригиналом 281131R100.
Полный размер
Невооруженным взглядом видно оригинальный цвет по краям и рабочий цвет по центру. Кто-то еще меняет раз в 30 тыс?
Полный размер
Фильтр меня устраивает полностью, отличное качество, четкая резинка
Полный размер
Крупным планом
———————————————————————————————————————————————
Полный размер
Когда он есть, инструмент хорош любой…
Полный размер
Единственный косяк с корпусом. Он одинаков с обоих сторон… Ну да морду лица поправили ребята с юмором
———————————————————————————————————————————————
Полный размер
Заодно маслице зачекать милое дело. Пробег всего 2009км и цвет рабочий. Масло работает!
———————————————————————————————————————————————
Полный размер
Ну и собственно чекаем после полной зарядки и холодной ночи и полдня простоя 12.4В (работает регик и прочее)
Полный размер
Вуаля, силь ву пле — 63.8Ач, 101% паспортной емкости достигнут
———————————————————————————————————————————————

Полный размер
Действо на пробеге 59020км. Косяк, что сбрасывается этот счетчик при откидывании клемм.
Полный размер
Магия цифр 2009 — 9020. Проехали
Так что, касаемо мелкого ремонта и обслуживания авто, никогда не надо торопиться и прилагать излишний момент сил… И вообще сборка трезвым противопоказана Таков путь!
Сколько раз чего только не делал, ну не было такого мини-залета…
Отсюда мораль, сопромат и усталость металла имеют место быть…
Рекомендую при очередном демонтаже аккума сменить болт, работающий на излом из-за пластины, с соседними болтами. Судя по всему они там и предусмотрены, как запасные предохранители в блоке с предами
Да прибудет с вами великая сила!