

Содержание:
- Важные логи сайта
- Расположение логов
- Чтение записей в логах
- Просмотр с помощью команды tail
- Просмотр с помощью ISPManager
- Программы для анализа логов
- Ведение логов медленных запросов сервера
- Ведение логов с помощью Logrotate
Логи сайта — это системные журналы, позволяющие получить информацию о посещении сайта ботами и пользователями, а также выявить скрытые проблемы на сервере — ошибки, битые ссылки, медленные запросы от сервера и многое другое.
Важные логи сайта
- Access.log — логи посещений пользователей и ботов. Позволяет составить более точную и подробную статистику, нежели сторонние ресурсы, выполняющие внешнее сканирование сайта и отправляющие ряд ненужных запросов серверу. Благодаря данному логу можно получить информацию об используемом браузере и IP-адрес посетителя, данные о местонахождении клиента (страна и город) и многое другое. Стоит обратить внимание, если сайт имеет высокую посещаемость, то анализ логов сервера потребует больше времени. Поэтому для составления статистики стоит использовать специализированные программы (анализаторы).
- Error.log — программные ошибки сервера. Стоит внимательно отнестись к анализу данного лога, ведь боты поисковиков, сканируя, получают все данные о работе сайта. При обнаружении большого количества ошибок, сайт может попасть под санкции поисковых систем. В свою очередь из записей данного журнала можно узнать точную дату и время ошибки, IP-адрес получателя, тип и описание ошибки.
- Slow.log (название зависит от используемой оболочки сервера) — в данный журнал записываются медленные запросы сервера. Так принято обозначать запросы с повышенным порогом задержки, выданные пользователю. Этот журнал позволяет выявить слабые места сервера и исправить проблему. Ниже будет рассмотрен способ включить ведение данного лога на разных типах серверов, а также настройка задержки, с которой записи будут заноситься в файл.
Расположение логов
Важно обратить внимание, что местоположение логов сайта по умолчанию зависит от используемого типа оболочки и может быть изменено администратором.
Стандартные пути до Error.log
Nginx
/var/log/nginx/error.log
Php-Fpm
/var/log/php-fpm/error.log
Apache (CentOS)
/var/log/httpd/error_log
Apache (Ubuntu, Debian)
/var/log/apache2/error_log
Стандартные пути до Access.log
Nginx
/var/log/nginx/access.log
Php-Fpm
/var/log/php-fpm/access.log
Apache (CentOS)
/var/log/httpd/access_log
Apache (Ubuntu, Debian)
/var/log/apache2/access_log
Чтение записей в логах
Записи в логах имеют структуру: одно событие – одна строка.
Записи в разных логах имеют общие черты, но количество подробностей отличается. Далее будут приведены примеры строк из разных системных журналов.
Примеры записей
Error.log
[Sat Sep 1 15:33:40.719615 2019] [:error] [pid 10706] [client 66.249.66.61:60699] PHP Notice: Undefined variable: moduleclass_sfx in /var/data/www/site.ru/modules/contacts/default.php on line 14
В приведенном примере:
- [Sat Sep 1 15:33:40.719615 2019] — дата и время события.
- [:error] [pid 10706] — ошибка и её тип.
- [client 66.249.66.61:60699] — IP-адрес подключившегося клиента.
- PHP Notice: Undefined variable: moduleclass_sfx in — событие PHP Notice. В данной ситуации — обнаружена неизвестная переменная.
- /var/data/www/site.ru/modules/contacts/default.php on line 14 — путь и номер строки в проблемном файле.
Access.log
194.61.0.6 – alex [10/Oct/2019:15:32:22 -0700] "GET /apache_pb.gif HTTP/1.0" 200 5396 "http://www.mysite/myserver.html" "Mozilla/4.08 [en] (Win98; I ;Nav)"
В приведенном примере:
- 194.61.0.6 — IP-адрес пользователя.
- alex — если пользователь зарегистрирован в системе, то в логах будет указан идентификатор.
- [10/Oct/2019:15:32:22 -0700]— дата и время записи.
- «GET /apache_pb.gif HTTP/1.0» — «GET» означает, что определённый документ со страницы сайта был отправлен пользователю. Существует команда «POST», наоборот отправляет конкретные данные (комментарий или любое другое сообщение) на сервер . Далее указан извлечённый документ «Apache_pb.gif», а также использованный протокол «HTTP/1.0».
- 200 5396 — код и количество байтов документа, которые были возвращены сервером.
- «http://www. www.mysite/myserver.html»— страница, с которой был произведён запрос на извлечение документа «Apache_pb.gif».
- «Mozilla/4.08 [en] (Win98; I ;Nav)» — данные о пользователе, которой произвёл запрос (используемый браузер и операционная система).
Просмотр логов сервера с помощью команды tail
Выполнить просмотр логов в Linux можно с помощью команды tail. Данный инструмент позволяет смотреть записи в логах, выводя последние строки из файла. По умолчанию tail выводит 10 строк.
Первый вариант использования Tail
tail -f /var/log/syslog
Аргумент «-f» позволяет команде делать просмотр событий в режиме реального времени, в ожидании новых записей в лог файлах. Для прерывания процесса следует нажать сочетание клавиш «Ctrl+C».
На место переменной «/var/log/syslog» в примере следует подставить актуальный адрес до нужных системных журналов.
Второй вариант использования Tail
tail -F /var/log/syslog
В Linux логи веб-сервера не ведутся до бесконечности, поскольку это усложняет их дальнейший анализ. При преодолении лимита записей, система переименует переполненный строками файл журнала и отправит в «архив». Вместо старого файла создастся новый, но с прежним названием.
Если будет использоваться аргумент «-f», команда продолжит отслеживание старого, переименованного журнала. Данный метод делает невозможным просмотр логов в реальном времени, поскольку файл более не актуален.
При использовании аргумента «-F», команда, после окончания записи старого журнала, перейдёт к чтению нового файла с логами. В таком случае просмотр логов в режиме реального времени продолжится.
Аналог команды Tail
tailf /var/log/syslog
Отличие команды tailf от предыдущей заключается в том, что она не обращается к файлу и файловой системе в период, когда запись логов не происходит. Это экономит ресурсы системы и заряд, если используется нестационарное устройство — ноутбук, смартфон или планшет.
Недостаток данного способа — проблема с чтением больших файлов. Если системный журнал достаточно большой, возникает вероятность отказа в работе программы.
Изменение стандартного количества строк для вывода
Как и отмечалось выше, по умолчанию выводится 10 строк. Если требуется увеличить или уменьшить их количество, в команду добавляется аргумент «-n» и необходимое число строк.
Пример:
tail -f -n 100 /var/log/syslog
При использовании данной команды будут показаны последние 100 строк журнала.
Просмотр логов с помощью ISPManager
Если на сервере установлен ISPManager, логи можно легко читать, используя приведенный ниже алгоритм.
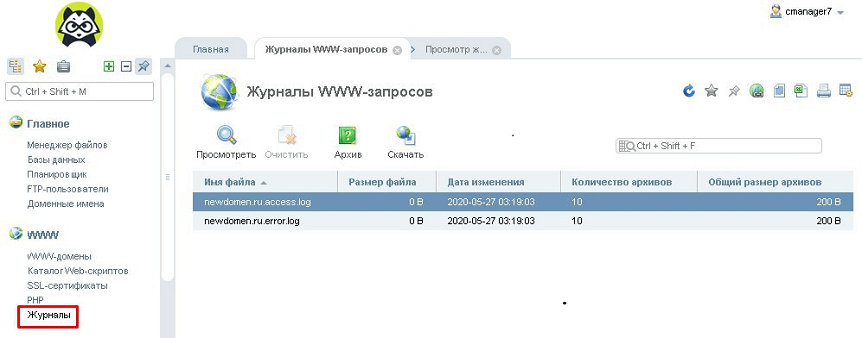
- На главной странице, в панели инструментов «WWW» нужно нажать на вкладку «Журналы».

- ISPManager выдаст журналы посещений и серверных ошибок в виде:
- ru.access.log;
- ru.error.log.*
* Вместо «newdomen.ru» из примера в выдаче будет название актуального домена.
Открыть файл лога можно, нажав на «Посмотреть» в верхнем меню.
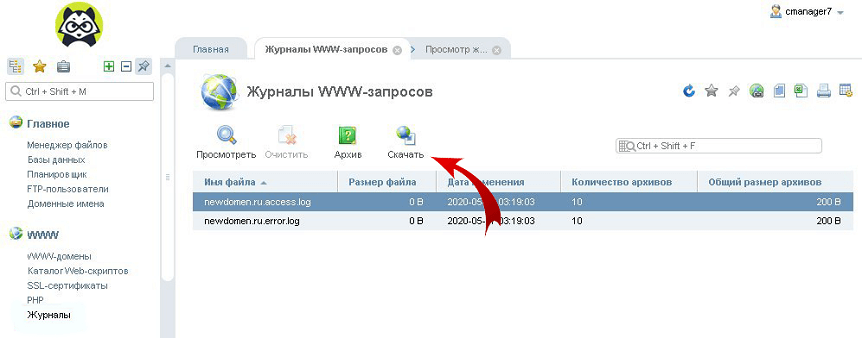
- Для просмотра всех записей журнала, необходимо нажать на «Скачать» и сохранить файл на локальный носитель.
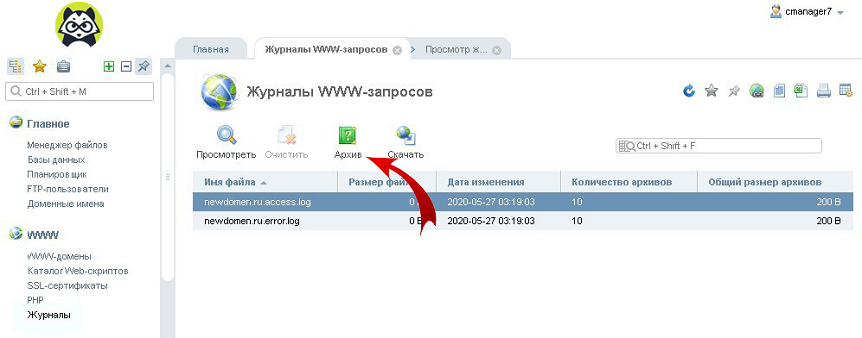
- Более старые версии логов можно найти во вкладке «Архив».
Программы для анализа логов
Анализировать журналы с большим количеством данных вручную не только сложно, но и чревато ошибками. Для упрощения работы с лог файлами было создано большое количество сервисов и утилит.
Инструменты для анализа логов делятся на два основных типа — статические и работающие в режиме реального времени.
Статические программы
Данный тип выполняет работу только с извлеченными логами, но обеспечивает быструю сортировку данных.
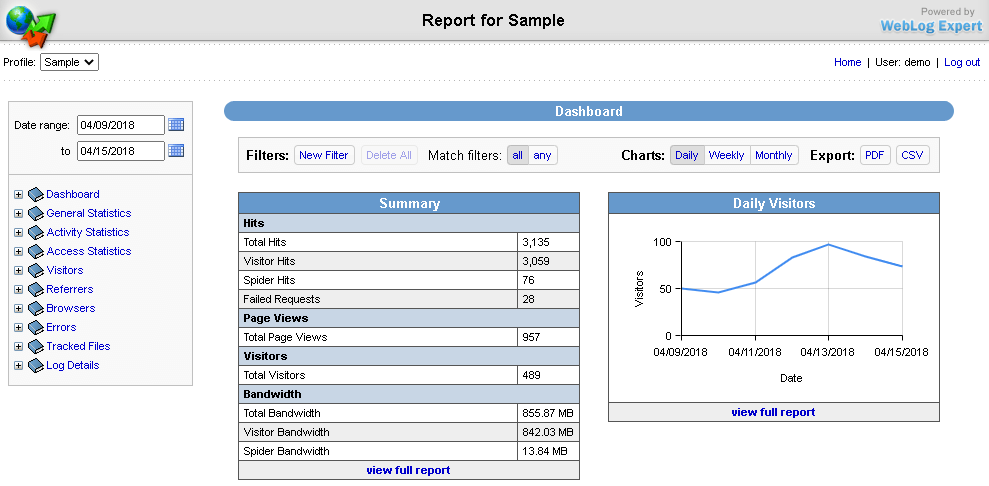
WebLog Expert
Возможности
- Предоставление информации об активность сайта, количестве посетителей, доступ к файлам, URL страницы, ссылающиеся страницы, информацию о пользователе (браузер и операционная система).
- Создание отчётов в формате HTML (.html), PDF (.pdf), CSV (.csv).
- Поддерживает анализ логов Nginx, Apache, ISS.
- Чтение файлов даже в архивах ZIP (.zip), GZ (.gz).
Web Log Explorer
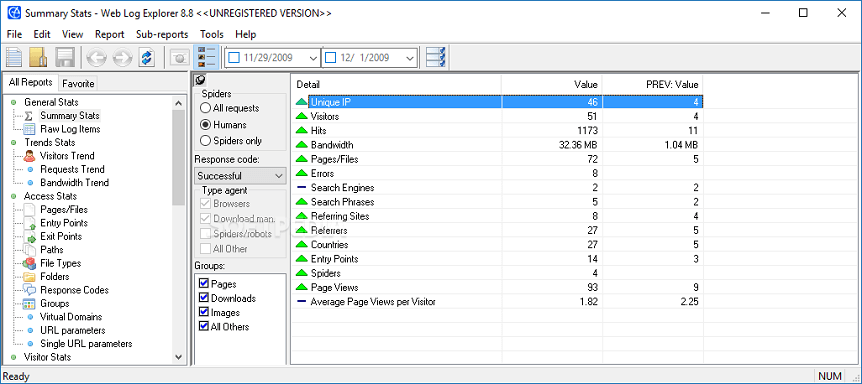
Возможности
- Создание многоуровневых отчётов, включающих количество посетителей, маршруты пользователей по сайту, местоположение хостов (страна и город), указанные в поисковике ключевые слова.
- Поддержка более 43 форматов логов.
- Возможность прямой загрузки логов с FTP, HTTP сервера.
- Чтение архивированных журналов.
Программы для анализа в режиме реального времени
Эти инструменты встраиваются в программную среду сервера, анализируют данные в реальном времени и записывают непрерывный отчёт.
GoAccess
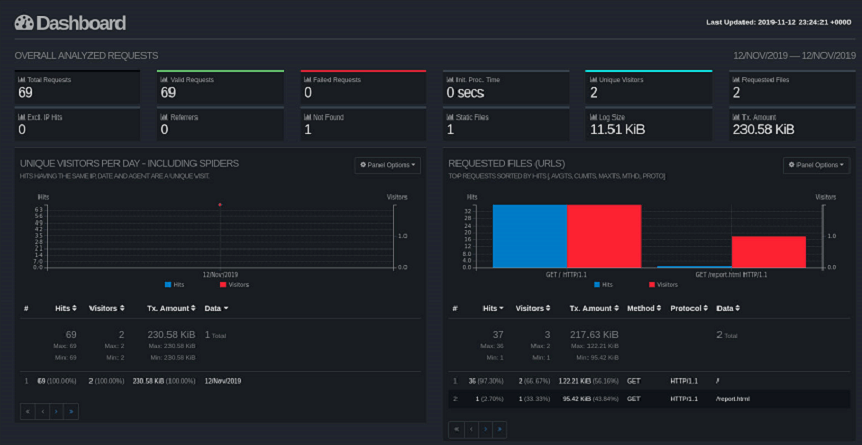
Возможности
- Автоматическая генерация отчёта в формате HTML (.html), JSON (.json), CSV (.csv).
- При подключении к серверу через SSH, возможен анализ в браузере и в терминале
- Поддержка почти всех форматов (Apache, Nginx, Amazon S3, Elastic Load Balancing, CloudFront и др.).
Logstash
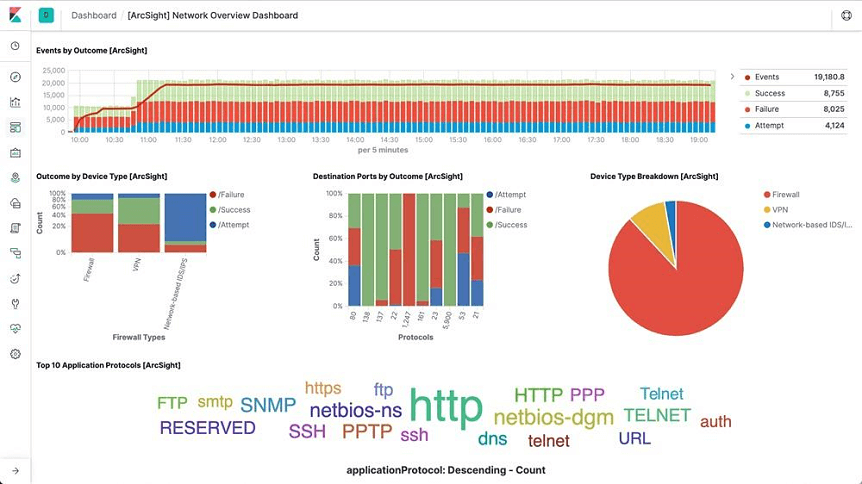
Возможности
- Постоянная генерация отчёта в файл JSON (.json).
- Получение и анализ информации из нескольких источников.
- Возможность пересылать журналы с помощью Filebeat.
- Поддержка анализа системных журналов.
- Поддерживается большое количество форматов: от Apache до Log4j (Java).
Ведения логов медленных запросов сервера
Анализ данного лога позволяет определить на какие типы запросов сервер отвечает долго. В идеале задержка должна составлять не более 1 секунды.
На некоторых типах оболочек (MySQL, PHP-FPM) ведение данного лога по умолчанию отключено. Процесс запуска и ведения зависит от сервера.
MySQL
Если сервер управляется с помощью MySQL, то необходимо создать каталог и сам файл для ведения журнала с помощью команд:
mkdir /var/log/mysql
touch /var/log/mysql/mysql-slow.log
Стоит изменить владельца файла, чтобы избежать дальнейших проблем с записью логов. Делается это командой:
chown mysql:mysql /var/log/mysql/mysql-slow.log
После выполнения предыдущих действий, нужно совершить вход в командную строку MySQL под учётной записью суперпользователя:
mysql -uroot -p
Для запуска и настройки ведения логов нужно последовательно ввести в терминале следующие команды:
> SET GLOBAL slow_query_log = 'ON';

> SET GLOBAL slow_launch_time = 2;

> SET GLOBAL slow_query_log_file = '/var/log/mysql/mysql-slow.log';

> FLUSH LOGS;
В примере:
- slow_query_log — запускает ведение журналов медленных запросов.
- slow_launch_time — указывает максимальную задержку отклика, после которой статистика запроса попадёт в журнал. В данном случае запись в логи происходит при преодолении откликом порога 2 секунды.
- slow_query_log_file — задаёт путь до используемого журнала.
Проверить статус и параметры ведения лога медленных запросов можно командой:
> SHOW VARIABLES LIKE '%slow%';
Выход из консоли MySQL выполняется командой:
> exit
После выполнения всех предыдущих действий, можно просмотреть логи сервера. Для этого в терминале вводится:
tail -f /var/log/mysql/mysql-slow.log
PHP-FPM
Для ведения журнала на данной оболочке, необходимо отредактировать параметры в конфигурационном файле. Для этого в терминале вводится команда:
vi /etc/php-fpm.d/www.conf
Далее нужно найти строки:
- request_slowlog_timeout = 10s — параметр, позволяющий указать задержку, с которой запись о длительном запросе попадёт в журнал.
- slowlog = /var/log/php-fpm/www-slow.log — параметр, указывающий путь до актуального файла логирования (.log).
После применения изменений, необходимо перезагрузить сервер PHP-FPM. Для этого в консоль вводится команда:
systemctl restart php-fpm
Просмотр логов запускается командой:
tail -f /var/log/php-fpm/www-slow.log
Анализ логов медленных запросов
Логи медленных запросов могут за незначительное время вырасти до огромных размеров. Для сортировки и отображения повторяющихся запросов рекомендуется использовать программу MySQLDumpSlow.
Для запуска просмотра логов с помощью этой утилиты, нужно составить команду по приведенному ниже алгоритму:
mysqldumpslow местонахождение/файла
Ведение логов в Logrotate
На больших ресурсах журналы могут достигать огромных размеров, поэтому нужно своевременно архивировать или очищать логи. С помощью утилиты Logrotate можно управлять ведением журналов: настроить период ротации (архивирование старого журнала и создание нового), период и количество хранения журналов и многое другое.
Изначально программа отсутствует в системе. Ниже приведены команды для инсталляции Logrotate из официальных репозиториев.
Ubuntu, Debian:
sudo apt install logrotate
CentOS:
sudo yum install logrotate
После установки необходимо проверить путь для будущих конфигурационных файлов. Для правильной работы они должны находится в папке «logrotate.d». Проверить данный параметр можно открыв конфигурационный файл командой:
nano /etc/logrotate.conf
В директории «RPM packages drop log rotation information into this directory» должна присутствовать строка:
include /etc/logrotate.d
Теперь создаётся конфигурационный файл «rsyslog.conf». В нём будет находиться конфигурацию по работе с логами. Для создания файла в терминале вводится команда:
sudo nano /etc/logrotate.d/rsyslog.conf
В окне терминала откроется текстовой редактор. Теперь нужно внести конфигурацию, как указано в образце. В качестве примера будет использоваться журнал посещений «Access.log» (Nginx).
/var/log/nginx/access.log {
daily
rotate 3
size 500M
compress
delaycompress
}
Теперь остаётся только запустить Logrotate. Для этого вводится команда:
sudo logrotate -d /etc/logrotate.d/rsyslog.conf
Для проверки правильности работы программы в терминале можно ввести команду:
ls /var/cron.daily/
В статье мы расскажем о том, что такое логи и как они помогут предотвратить аномальную нагрузку на сервер.
- Что такое логи
- Как читать логи
- Логи доступа (access_log)
- Логи ошибок (error_log)
- FTP-логи
- Логи операций в панели управления
- Как анализировать логи при высокой нагрузке на сервер
Что такое логи
Логи — это файлы текстового формата, в которых хранятся следующие данные:
- информация о пользователях,
- информация о действиях на сервере,
- информация о дате и времени операций,
- системная информация о работе сервера.
На хостинге SpaceWeb хранятся логи за прошедший месяц (30 дней): они создаются автоматически в хронологическом порядке. Один файл лога включает в себя историю операций за один прошедший день.
Как читать логи
Каждый log-файл имеет собственную структуру: она отличается в зависимости от типа логов. Чаще всего используются:
- логи доступа или access_log,
- логи ошибок или error_log,
- FTP-логи,
- логи операций в панели управления.
Анализ логов проводится по-разному: это зависит от операции, которую нужно отследить. Например, если вы хотите поверить визиты на сайт и в панель управления, потребуются логи доступа и логи операций в панели управления. О типах логов и их назначении расскажем ниже.
Логи доступа (access_log)
access.log — это текстовый файл, в который записываются все обращения к веб-серверу. Его можно использовать, чтобы получить информацию о посещении вашего ресурса.
Лог доступа имеет следующий вид:
test.ru 123.123.123.123 — — [01/Jan/2022:00:00:00 +0000] «GET /index.html HTTP/1.1» 200 198 «https://test.ru/» «Mozilla/5.0 (compatible; MSIE 6.0; AOL 9.0; Windows NT 5.1)» 16143 0
Где:
- test.ru — доменное имя сайта;
- 123.123.123.123 — IP-адрес, с которого обращается клиент;
- 01/Jan/2022:00:00:00 +0000 — дата и время запроса;
- GET — метод запроса;
- 200 — последний код ответа, если произошло внутреннее перенаправление (в примере — успешное обращение);
- 198 — размер ответа в байтах без HTTP-заголовка. Если ответ был размера 0, в лог-файле он отобразится знаком -;
- «https://test.ru/» «Mozilla/5.0 (compatible; MSIE 6.0; AOL 9.0; Windows NT 5.1)» — информация о клиенте (браузере, с которого посетили сайт);
- 16143 — PID процесса Apache;
- 0 — время работы процесса Apache.
Если на вашем аккаунте отключено ведение логов доступа, его можно включить в панели управления в разделе «Статистика и логи». Если вам нужны логи за прошедшие дни, запросите их в службе технической поддержки.
Логи ошибок (error_log)
error.log — это файл, в котором фиксируются все типы ошибок сервера. Логи ошибок позволяют отследить, в какой момент возникла проблема: это поможет в ее решении.
Лог ошибок (error.log) имеет следующий вид:
test.ru [Fri Jan 01 00:00:00 2022] [error] [client 123.123.123.123] File does not exist: /home/d/test/public_html/favicon.ico
Где:
- test.ru — доменное имя сайта;
- Fri Jan 01 00:00:00 2022 — дата и время возникновения ошибки;
- 123.123.123.123 — IP-адрес, с которого обратился клиент.
Если на вашем аккаунте отключено ведение лога ошибок, его можно включить в панели управления в разделе «Статистика и логи». Если вам нужны логи за прошедшие дни, запросите их в службе технической поддержки.
FTP-логи
Логи FTP помогают отследить подключения по протоколу FTP и действия при удаленном соединении с сервером.
FTP-лог имеет следующий вид:
2022-01-01T00:00:00+03:00 vhXX pure-ftpd: (?@123.123.123.123) [DEBUG] Command [user] [vhXXtest]
2022-01-01T00:01:00+03:00 vhXX pure-ftpd: (?@123.123.123.123) [INFO] vhXXtest is now logged in
2022-01-01T00:02:00+03:00 vhXX pure-ftpd: (vhXXtest@123.123.123.123) [DEBUG] Command [retr] [configuration.php]
2022-01-01T00:03:00+03:00 vhXX pure-ftpd: (vhXXtest@123.123.123.123) [NOTICE] /home/v/vhXXtest/public_html//configuration.php downloaded (5317 bytes, 77503.32KB/sec)
2022-01-01T00:04:00+03:00 vhXX pure-ftpd: (vhXXtest@123.123.123.123) [DEBUG] Command [pasv] []
2022-01-01T00:05:00+03:00 vhXX pure-ftpd: (vhXXtest@123.123.123.123) [DEBUG] Command [stor] [configuration.php]
2022-01-01T00:06:00+03:00 vhXX pure-ftpd: (vhXXtest@123.123.123.123) [NOTICE] /home/v/vhXXtest/public_html//configuration.php uploaded (5165 bytes, 985.55KB/sec)
2022-01-01T00:07:00+03:00 vhXX pure-ftpd: (vhXXtest@123.123.123.123) [INFO] Logout.
Где:
- 2022-01-01T00:00:00+03:00 — дата и время действия на сервере FTP,
- 123.123.123.123 — IP-адрес сервера,
- vhXX — имя сервера,
- vhXXtest — имя FTP-пользователя.
Логи FTP можно получить при обращении в службу технической поддержки.
Логи операций в панели управления
Логи операций позволяют отследить всю активность в панели управления SpaceWeb. Благодаря им вы сможете выявить несанкционированные посещения в системе.
Логи операций в панели управления имеют следующий вид:
46085314 Неуспешная авторизация в клиентской ПУ 123.123.123.123 2022-01-01 00:00:00
46172855 Сделан заказ на домен test.ru; mov; test 2022-01-01 00:01:00
46172895 Удалён домен test.ru test 2022-01-01 00:10:00
46518875 Выход из клиентской ПУ 123.123.123.123 test 2022-01-01 00:11:00
46554201 Создание папки /testforum test 2022-01-02 00:00:00
46554208 Создана база данных test_bd test 2022-01-02 00:10:00
46554210 Установка CMS из панели управления smf test.ru:/testforum/ test 2022-01-02 00:20:00
Где:
- 46085314 — номер операции,
- 123.123.123.123 — IP-адрес сервера,
- test — имя пользователя панели управления,
- 2022-01-01 00:00:00 — дата и время выполнения операции.
Логи операций в панели управления можно включить в разделе «Профиль» на вкладке Логи ПУ.
Как анализировать логи при высокой нагрузке на сервер
Для анализа логов подключитесь к серверу по SSH. Далее введите команду, которая подходит для вашего случая.
- Проверьте, на какой странице было наибольшее число посещений за день:
cat test.ru/access_log | awk ‘{ print $8}’ | sort | uniq -c | sort -n -k 1 | tail -n 50
Вместо test.ru укажите корневую директорию сайта.
- Чтобы проверить запросы за несколько прошедших дней, выполните команду:
cat test.ru/access_log*gz | awk ‘{ print $8}’ | sort | uniq -c | sort -n -k 1 | tail -n 50
Вместо test.ru укажите корневую директорию сайта. После этого сформируется архив с журналом логов.
- Выявить аномальное число запросов с одного IP-адреса за день:
cat test.ru/access_log | awk ‘{ print $2}’ | sort | uniq -c | sort -n -k 1 | tail -n 50
Вместо test.ru укажите корневую директорию сайта.
- Чтобы проверить запросы за несколько прошедших дней, выполните команду:
cat test.ru/access_log*gz | awk ‘{ print $2}’ | sort | uniq -c | sort -n -k 1 | tail -n 50
Вместо test.ru укажите корневую директорию сайта. После этого сформируется архив с журналом логов.
In this tutorial, you will learn everything you need to know about logging in
NGINX and how it can help you troubleshoot and quickly resolve any problem you
may encounter on your web server. We will discuss where the logs are stored and
how to access them, how to customize their format, and how to centralize them in
one place with Syslog or a log management service.
Here’s an outline of what you will learn by following through with this tutorial:
- Where NGINX logs are stored and how to access them.
- How to customize the NGINX log format and storage location to fit your needs.
- How to utilize a structured format (such as JSON) for your NGINX logs.
- How to centralize NGINX logs through Syslog or a managed cloud-based service.
Prerequisites
To follow through with this tutorial, you need the following:
- A Linux server that includes a non-root user with
sudoprivileges. We tested
the commands shown in this guide on an Ubuntu 20.04 server. - The
NGINX web server installed
and enabled on your server.
🔭 Want to centralize and monitor your NGINX logs?
Head over to Logtail and start ingesting your logs in 5 minutes.
Step 1 — Locating the NGINX log files
NGINX writes logs of all its events in two different log files:
- Access log: this file contains information about incoming requests and
user visits. - Error log: this file contains information about errors encountered while
processing requests, or other diagnostic messages about the web server.
The location of both log files is dependent on the host operating system of the
NGINX web server and the mode of installation. On most Linux distributions, both
files will be found in the /var/log/nginx/ directory as access.log and
error.log, respectively.
A typical access log entry might look like the one shown below. It describes an
HTTP GET request to the server for a favicon.ico file.
Output
217.138.222.101 - - [11/Feb/2022:13:22:11 +0000] "GET /favicon.ico HTTP/1.1" 404 3650 "http://135.181.110.245/" "Mozilla/5.0 (Windows NT 10.0; Win64; x64) AppleWebKit/537.36 (KHTML, like Gecko) Chrome/98.0.4758.87 Safari/537.36" "-"
Similarly, an error log entry might look like the one below, which was generated
due to the inability of the server to locate the favicon.ico file that was
requested above.
Output
2022/02/11 13:12:24 [error] 37839#37839: *7 open() "/usr/share/nginx/html/favicon.ico" failed (2: No such file or directory), client: 113.31.102.176, server: _, request: "GET /favicon.ico HTTP/1.1", host: "192.168.110.245:80"
In the next section, you’ll see how to view both NGINX log files from the
command line.
Step 2 — Viewing the NGINX log files
Examining the NGINX logs can be done in a variety of ways. One of the most
common methods involves using the tail command to view logs entries in
real-time:
sudo tail -f /var/log/nginx/access.log
You will observe the following output:
Output
107.189.10.196 - - [14/Feb/2022:03:48:55 +0000] "POST /HNAP1/ HTTP/1.1" 404 134 "-" "Mozila/5.0"
35.162.122.225 - - [14/Feb/2022:04:11:57 +0000] "GET /.env HTTP/1.1" 404 162 "-" "Mozilla/5.0 (Windows NT 10.0; Win64; x64; rv:58.0) Gecko/20100101 Firefox/58.0"
45.61.172.7 - - [14/Feb/2022:04:16:54 +0000] "GET /.env HTTP/1.1" 404 197 "-" "Mozilla/5.0 (X11; Linux x86_64) AppleWebKit/537.36 (KHTML, like Gecko) Chrome/81.0.4044.129 Safari/537.36"
45.61.172.7 - - [14/Feb/2022:04:16:55 +0000] "POST / HTTP/1.1" 405 568 "-" "Mozilla/5.0 (X11; Linux x86_64) AppleWebKit/537.36 (KHTML, like Gecko) Chrome/81.0.4044.129 Safari/537.36"
45.137.21.134 - - [14/Feb/2022:04:18:57 +0000] "GET /dispatch.asp HTTP/1.1" 404 134 "-" "Mozilla/5.0 (iPad; CPU OS 7_1_2 like Mac OS X; en-US) AppleWebKit/531.5.2 (KHTML, like Gecko) Version/4.0.5 Mobile/8B116 Safari/6531.5.2"
23.95.100.141 - - [14/Feb/2022:04:42:23 +0000] "HEAD / HTTP/1.0" 200 0 "-" "-"
217.138.222.101 - - [14/Feb/2022:07:38:40 +0000] "GET /icons/ubuntu-logo.png HTTP/1.1" 404 197 "http://168.119.119.25/" "Mozilla/5.0 (Windows NT 10.0; Win64; x64) AppleWebKit/537.36 (KHTML, like Gecko) Chrome/98.0.4758.87 Safari/537.36"
217.138.222.101 - - [14/Feb/2022:07:38:42 +0000] "GET /favicon.ico HTTP/1.1" 404 197 "http://168.119.119.25/" "Mozilla/5.0 (Windows NT 10.0; Win64; x64) AppleWebKit/537.36 (KHTML, like Gecko) Chrome/98.0.4758.87 Safari/537.36"
217.138.222.101 - - [14/Feb/2022:07:44:02 +0000] "GET / HTTP/1.1" 304 0 "-" "Mozilla/5.0 (Windows NT 10.0; Win64; x64) AppleWebKit/537.36 (KHTML, like Gecko) Chrome/98.0.4758.87 Safari/537.36"
217.138.222.101 - - [14/Feb/2022:07:44:02 +0000] "GET /icons/ubuntu-logo.png HTTP/1.1" 404 197 "http://168.119.119.25/" "Mozilla/5.0 (Windows NT 10.0; Win64; x64) AppleWebKit/537.36 (KHTML, like Gecko) Chrome/98.0.4758.87 Safari/537.36"
The tail command prints the last 10 lines from the selected file. The -f
option causes it to continue displaying subsequent lines that are added to the
file in real-time.
To examine the entire contents of an NGINX log file, you can use the cat
command or open it in your text editor:
sudo cat /var/log/nginx/error.log
If you want to filter the lines that contain a specific term, you can use the
grep command as shown below:
sudo grep "GET /favicon.ico" /var/log/nginx/access.log
The command above will print all the lines that contain GET /favicon.ico so we
can see how many requests were made for that resource.
Step 3 — Configuring NGINX access logs
The NGINX access log stores data about incoming client requests to the server
which is beneficial when deciphering what users are doing in the application,
and what resources are being requested. In this section, you will learn how to
configure what data is stored in the access log.
One thing to keep in mind while following through with the instructions below is
that you’ll need to restart the nginx service after modifying the config file
so that the changes can take effect.
sudo systemctl restart nginx
Enabling the access log
The NGINX access Log should be enabled by default. However, if this is not the
case, you can enable it manually in the Nginx configuration file
(/etc/nginx/nginx.conf) using the access_log directive within the http
block.
Output
http {
  access_log /var/log/nginx/access.log;
}
This directive is also applicable in the server and location configuration
blocks for a specific website:
Output
server {
   access_log /var/log/nginx/app1.access.log;

  location /app2 {
    access_log /var/log/nginx/app2.access.log;
  }
}
Disabling the access log
In cases where you’d like to disable the NGINX access log, you can use the
special off value:
You can also disable the access log on a virtual server or specific URIs by
editing its server or location block configuration in the
/etc/nginx/sites-available/ directory:
Output
server {
  listen 80;

  access_log off;

  location ~* .(woff|jpg|jpeg|png|gif|ico|css|js)$ {
    access_log off;
  }
}
Logging to multiple access log files
If you’d like to duplicate the access log entries in separate files, you can do
so by repeating the access_log directive in the main config file or in a
server block as shown below:
Output
access_log /var/log/nginx/access.log;
access_log /var/log/nginx/combined.log;
Don’t forget to restart the nginx service afterward:
sudo systemctl restart nginx
Explanation of the default access log format
The access log entries produced using the default configuration will look like
this:
Output
127.0.0.1 alice Alice [07/May/2021:10:44:53 +0200] "GET / HTTP/1.1" 200 396 "-" "Mozilla/5.0 (Windows NT 10.0; Win64; x64) AppleWebKit/537.36 (KHTML, like Gecko) Chrome/90.0.4531.93 Safari/537.36"
Here’s a breakdown of the log message above:
127.0.0.1: the IP address of the client that made the request.alice: remote log name (name used to log in a user).Alice: remote username (username of logged-in user).[07/May/2021:10:44:53 +0200]: date and time of the request."GET / HTTP/1.1": request method, path and protocol.200: the HTTP response code.396: the size of the response in bytes."-": the IP address of the referrer (-is used when the it is not
available)."Mozilla/5.0 (Windows NT 10.0; Win64; x64) AppleWebKit/537.36 (KHTML, like Gecko) Chrome/90.0.4531.93 Safari/537.36"—
detailed user agent information.
Step 4 — Creating a custom log format
Customizing the format of the entries in the access log can be done using the
log_format directive, and it can be placed in the http, server or
location blocks as needed. Here’s an example of what it could look like:
Output
log_format custom '$remote_addr - $remote_user [$time_local] ' '"$request" $status $body_bytes_sent ' '"$http_referer" "$http_user_agent"';
This yields a log entry in the following format:
Output
217.138.222.109 - - [14/Feb/2022:10:38:35 +0000] "GET /favicon.ico HTTP/1.1" 404 197 "http://192.168.100.1/" "Mozilla/5.0 (Windows NT 10.0; Win64; x64) AppleWebKit/537.36 (KHTML, like Gecko) Chrome/98.0.4758.87 Safari/537.36"
The syntax for configuring an access log format is shown below. First, you need
to specify a nickname for the format that will be used as its identifier, and
then the log format string that represents the details and formatting for each
log message.
Output
log_format <nickname> '<formatting_variables>';
Here’s an explanation of each variable used in the custom log format shown
above:
$remote_addr: the IP address of the client$remote_user: information about the user making the request$time_local: the server’s date and time.$request: actual request details like path, method, and protocol.$status: the response code.$body_bytes_sent: the size of the response in bytes.$http_referer: the IP address of the HTTP referrer.$http_user_agent: detailed user agent information.
You may also use the following variables in your custom log format
(see here for the complete list):
$upstream_connect_time: the time spent establishing a connection with an
upstream server.$upstream_header_time: the time between establishing a connection and
receiving the first byte of the response header from the upstream server.$upstream_response_time: the time between establishing a connection and
receiving the last byte of the response body from the upstream server.$request_time: the total time spent processing a request.$gzip_ratio: ration of gzip compression (if gzip is enabled).
After you create a custom log format, you can apply it to a log file by
providing a second parameter to the access_log directive:
Output
access_log /var/log/nginx/access.log custom;
You can use this feature to log different information in to separate log files.
Create the log formats first:
Output
log_format custom '$remote_addr - $remote_user [$time_local] ' '"$request" $status $body_bytes_sent ' '"$http_referer"';
log_format agent "$http_user_agent";
Then, apply them as shown below:
Output
access_log /var/log/nginx/access.log custom;
access_log /var/log/nginx/agent_access.log agent;
This configuration ensures that user agent information for all incoming requests
are logged into a separate access log file.
Step 5 — Formatting your access logs as JSON
A common way to customize NGINX access logs is to format them as JSON. This is
quite straightforward to achieve by combining the log_format directive with
the escape=json parameter introduced in Nginx 1.11.8 to escape characters that
are not valid in JSON:
Output
log_format custom_json escape=json
  '{'
    '"time_local":"$time_local",'
    '"remote_addr":"$remote_addr",'
    '"remote_user":"$remote_user",'
    '"request":"$request",'
    '"status": "$status",'
    '"body_bytes_sent":"$body_bytes_sent",'
    '"request_time":"$request_time",'
    '"http_referrer":"$http_referer",'
    '"http_user_agent":"$http_user_agent"'
  '}';
After applying the custom_json format to a log file and restarting the nginx
service, you will observe log entries in the following format:
{
  "time_local": "14/Feb/2022:11:25:44 +0000",
  "remote_addr": "217.138.222.109",
  "remote_user": "",
  "request": "GET /icons/ubuntu-logo.png HTTP/1.1",
  "status": "404",
  "body_bytes_sent": "197",
  "request_time": "0.000",
  "http_referrer": "http://192.168.100.1/",
  "http_user_agent": "Mozilla/5.0 (Windows NT 10.0; Win64; x64) AppleWebKit/537.36 (KHTML, like Gecko) Chrome/98.0.4758.87 Safari/537.36"
}
Step 6 — Configuring NGINX error logs
Whenever NGINX encounters an error, it stores the event data in the error log so
that it can be referred to later by a system administrator. This section will
describe how to enable and customize the error logs as you see fit.
Enabling the error log
The NGINX error log should be enabled by default. However, if this is not the
case, you can enable it manually in the relevant NGINX configuration file
(either at the http, server, or location levels) using the error_log
directive.
Output
error_log /var/log/nginx/error.log;
The error_log directive can take two parameters. The first one is the location
of the log file (as shown above), while the second one is optional and sets the
severity level of the log. Events with a lower severity level than set one will
not be logged.
Output
error_log /var/log/nginx/error.log info;
These are the possible levels of severity (from lowest to highest) and their
meaning:
debug: messages used for debugging.info: informational messages.notice: a notable event occurred.warn: something unexpected happened.error: something failed.crit: critical conditions.alert: errors that require immediate action.emerg: the system is unusable.
Disabling the error log
The NGINX error log can be disabled by setting the error_log directive to
off or by redirecting it to /dev/null:
Output
error_log off;
error_log /dev/null;
Logging errors into multiple files
As is the case with access logs, you can log errors into multiple files, and you
can use different severity levels too:
Output
error_log /var/log/nginx/error.log info;
error_log /var/log/nginx/emerg_error.log emerg;
This configuration will log every event except those at the debug level event
to the error.log file, while emergency events are placed in a separate
emerg_error.log file.
Step 7 — Sending NGINX logs to Syslog
Apart from logging to a file, it’s also possible to set up NGINX to transport
its logs to the syslog service especially if you’re already using it for other
system logs. Logging to syslog is done by specifying the syslog: prefix to
either the access_log or error_log directive:
Output
error_log  syslog:server=unix:/var/log/nginx.sock debug;
access_log syslog:server=[127.0.0.1]:1234,facility=local7,tag=nginx,severity=info;
Log messages are sent to a server which can be specified in terms of a domain
name, IPv4 or IPv6 address or a UNIX-domain socket path.
In the example above, error log messages are sent to a UNIX domain socket at the
debug logging level, while the access log is written to a syslog server with
an IPv4 address and port 1234. The facility= parameter specifies the type of
program that is logging the message, the tag= parameter applies a custom tag
to syslog messages, and the severity= parameter sets the severity level of
the syslog entry for access log messages.
For more information on using Syslog to manage your logs, you can check out our
tutorial on viewing and configuring system logs on
Linux.
Step 8 — Centralizing your NGINX logs
In this section, we’ll describe how you can centralize your NGINX logs in a log
management service through Vector, a
high-performance tool for building observability pipelines. This is a crucial
step when administrating multiple servers so that you can monitor all your logs
in one place (you can also centralize your logs with an Rsyslog
server).
The following instructions assume that you’ve signed up for a free
Logtail account and retrieved your source
token. Go ahead and follow the relevant
installation instructions for Vector
for your operating system. For example, on Ubuntu, you may run the following
commands to install the Vector CLI:
curl -1sLf  'https://repositories.timber.io/public/vector/cfg/setup/bash.deb.sh'  | sudo -E bash
$ sudo apt install vector
After Vector is installed, confirm that it is up and running through
systemctl:
You should observe that it is active and running:
Output
● vector.service - Vector
     Loaded: loaded (/lib/systemd/system/vector.service; enabled; vendor preset: enabled)
     Active: active (running) since Tue 2022-02-08 10:52:59 UTC; 48s ago
       Docs: https://vector.dev
    Process: 18586 ExecStartPre=/usr/bin/vector validate (code=exited, status=0/SUCCESS)
   Main PID: 18599 (vector)
      Tasks: 3 (limit: 2275)
     Memory: 6.8M
     CGroup: /system.slice/vector.service
             └─18599 /usr/bin/vector
Otherwise, go ahead and start it with the command below.
sudo systemctl start vector
Afterward, change into a root shell and append your Logtail vector configuration
for NGINX into the /etc/vector/vector.toml file using the command below. Don’t
forget to replace the <your_logtail_source_token> placeholder below with your
source token.
sudo -s
$ wget -O ->> /etc/vector/vector.toml
    https://logtail.com/vector-toml/nginx/<your_logtail_source_token>
Then restart the vector service:
sudo systemctl restart vector
You will observe that your NGINX logs will start coming through in Logtail:
Conclusion
In this tutorial, you learned about the different types of logs that the NGINX
web server keeps, where you can find them, how to understand their formatting.
We also discussed how to create your own custom log formats (including a
structured JSON format), and how to log into multiple files at once. Finally, we
demonstrated the process of sending your logs to Syslog or a log management
service so that you can monitor them all in one place.
Thanks for reading, and happy logging!
Centralize all your logs into one place.
Analyze, correlate and filter logs with SQL.
Create actionable
dashboards.
Share and comment with built-in collaboration.
Got an article suggestion?
Let us know


Next article
How to Get Started with Logging in Node.js
Learn how to start logging with Node.js and go from basics to best practices in no time.
→

This work is licensed under a Creative Commons Attribution-NonCommercial-ShareAlike 4.0 International License.

В работе системного администратора, нередко возникает необходимость посмотреть логи сервера (Server Logs), с какими задачами работал сервер в конкретное время, какие действия совершали пользователи. Причины возникновения этой необходимости могут быть разные:
- Сбой в работе сервера;
- Выявление неблагонамеренных действий;
- Анализ рабочих процессов.
Всю необходимую информацию можно получить в логи сервера (Server Logs), то есть файлах, в которые вносятся записи о различных процессах, действиях пользователей, и т.п. Но, для этого необходимо понимать, где хранятся эти данные, а главное, как с ними работать.
Что такое логи сервера?
Собственно говоря, само слово «логи сервера», является банальной транслитерацией, от словосочетания «server log», которое переводится как «журнал сервера».
Существуют следующие типы логов:
- Ошибки – записи, фиксирующие различные сбои в работе сервера, или при обращении к конкретным функциям или задачам. С их помощью можно быстро ликвидировать разные баги и сбои;
- Доступ – записи, которые фиксируют точные дату и время подключения конкретного пользователя, каким образом он попал на сайт, и т.д. Позволяют проводить аналитическую работу, а также находить уязвимые места, в тех случаях, когда ресурс пытались взломать;
- Прочее – записи с данными о работе разных компонентов сервера, например, почты.
Разумеется, если вы не наблюдаете никаких проблем, или подозрительных моментов, связанных с работой сервера, то нет никакой необходимости в частом просмотре логов. Тем не менее, специалисты рекомендуют выборочно изучать их, хотя бы раз в год.
С другой стороны, если уже произошло какое-то ЧП, например, сайт резко начал выдавать большое количество ошибок, подвергся спам-атаке, или стремительно возросла нагрузка на сервер, то изучение логов, позволит быстро понять в чем проблема и устранить её.
Тем не менее, для большинства рядовых пользователей записи в log-файлах, представляют собой просто странный набор символов. А значит, нужно понять, как правильно их читать.
Как правильно читать логи сервера?

В данном примере, мы разберем два типа записей, касающихся логов доступа и ошибок, поскольку именно к ним чаще всего обращаются, при возникновении каких-то проблем.
Итак, запись лога доступа, из файла access.log:
mysite.biz 25.34.94.132 — — [21/Nov/2017:03:21:08 +0200] «GET /blog/2/ HTTP/1.0» 200 18432 «-» «Unknow Bot (http://www.unknow.com/bot; [email protected])»
Что она обозначает:
- mysite.biz – домен сайта, которым вы интересуетесь;
- 34.94.132 – IP-адрес, который использовал пользователь при заходе на сайт;
- [21/Nov/2017:03:21:08 +0200] – дата, точное время и часовой пояс пользователя;
- GET – запрос, который отправляется для получения данных. В том случае, если пользователь передает данные, запрос будет «POST»;
- /blog/2/ — относительный адрес страницы, к которой был обращен запрос;
- HTTP/1.0 – используемый протокол;
- 200 – код ответа на запрос;
- 18432 – количество данных, переданных по запросу, в байтах;
- Unknow Bot (http://www.unknow.com/bot; [email protected]) – данные о роботе, или реальном человеке, который зашел на сайт. В том случае, если это человек, будет отображена ОС, тип устройства и т.д. В конкретном примере на сайт зашел робот-парсер, принадлежащий ресурсу unknow.com.
Таким образом, мы узнали, что с IP-адреса 25.34.94.132, двадцать первого ноября, 2017-го года, в три часа, двадцать одну минуту и восемь секунд, на наш сайт заходил бот, принадлежащий другому веб-ресурсу. Он отправил запрос на получение данных, и получил 18432 байт информации.
Теперь можно заблокировать доступ для ботов от этого сайта, либо от всех, кто пользуется этим IP, разумеется, если в этом есть необходимость.
Логи ошибок, можно посмотреть в файле с говорящим именем – error.log. Они выглядят следующим образом:
[Sat Oct 1 18:23:28.719615 2019] [:error] [pid 10706] [client 44.248.44.22:35877]
PHP Notice: Undefined variable: moduleclass_sfx in
/var/data/www/mysite.biz/modules/contacts/default.php on line 13
Что здесь написано?
- Дата, время и тип ошибки, а также IP-адрес, который использовал посетитель;
- Тип события, в данном случае – «PHP Notice» (уведомление), а также уточнение, что в данном случае, мы имеем дело с неизвестной переменной;
- Местоположение файла с уведомлением, а также строка, на которой оно находится.
Если говорить просто, то в данном случае мы имеем сообщение о том, что первого октября, в 18:23, 2019-го года, произошла ошибка, связанная с модулем контактов.
Разумеется, даже после расшифровки, полученные данные не так просто проанализировать. Именно поэтому, для удобной обработки данных из логов сервера, используется различное программное обеспечение. К таким программам относятся: Awstats, Webtrends, WebAlyzer, и многие другие.
Сегодня существует множество платных и бесплатных вариантов программ, для обработки и анализа лог-файлов.
Логи серверов на Windows
У логов серверов на Windows, изначально более удобный и структурированный вывод информации, в виде простой и понятной таблицы.
Существует несколько уровней событий:
- Подробности;
- Сведения;
- Предупреждение;
- Ошибка;
- Критический.
Также есть возможность быстрой фильтрации и сортировки записей, в зависимости от того, какие данные вы хотите получить.
Логи SQL сервера
На сегодняшний день, базы данных SQL, являются наиболее распространенным способом работы с большими объемами информации. В первую очередь, логи sql сервера, стоит изучить, если вы не уверены в том, что какие-то процессы были успешно завершены. Этими процессами могут быть:
- Резервное копирование;
- Восстановление данных;
- Массовые изменения;
- Различные скрипты, и программы для обработки данных.
Для того, чтобы просмотреть записи в логах, можно использовать SQL Server Management Studio, либо другой, удобный вам редактор текстов. Записи распределены по журналам следующих типов:
- Сбор данных;
- Database Mail;
- SQL Сервер;
- События Windows;
- Журнал заданий;
- Коллекция аудита;
- SQL Сервер, агент.
Для того, чтобы получить доступ к журналам, необходимо иметь права «securityadmin».
Как включить или выключить запись логов сервера?
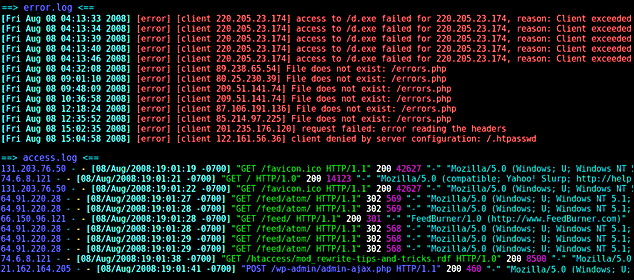
Для того, чтобы осуществить эту операцию, нужно зайти в административную панель вашего хостера. Как правило, в основном меню есть раздел «Журнал», или «Логи», в котором можно включить или выключить запись данных о предоставленном доступе, ошибках, и т.п.
Где находятся логи сервера?
Расположение журналов, зависит в первую очередь от используемой вами операционной системы.
Логи серверов с CentOS, или Fedora, хранятся в дирректории «/var/log/».
Названия файлов:
- Журнал ошибок – «error.log»;
- Журнал nginx – «nginx»;
- Журнал доступов – «log»;
- Основной журнал – «syslog»;
- Журнал загрузки системы – «dmesg».
Логи ошибок, связанных с работой MySQL, находятся в директории «/var/lib/mysql/», в файле «$hostname.err».
Для операционных систем Debian и Ubuntu, логи сервера располагаются в папке «/var/log/», в файлах:
- Nginx — журнал nginx;
- /mysql/error.log – журнал ошибок для баз данных MySQL;
- Syslog – основной журнал;
- Dmesg – загрузка системы, драйвера;
- Apache2 – журнал веб-сервера Apache.
Как видите, у всех ОС, основанных на Linux, логи сервера, как правило имеют одинаковые названия, и директории.
С логами для Windows server, дело обстоит несколько иначе. Если нужно просмотреть журналы, необходимо войти в систему, нажать клавиши «Win» и «R», после чего откроется окно просмотра событий, где есть возможность подобрать интересующие нас логи.
Если вы хотите посмотреть логи PowerShell, то необходимо открыть программу и ввести команду: «Get-EventLog -Logname ‘System’».
Все данные будут выведены в виде удобной таблицы.
Пример работы с логами сервера
Представьте себе, что вы внезапно обнаружили существенное увеличение нагрузки на ваш сервер, связанное с внешними воздействиями. Сервисы аналитики начинают регистрировать рекорды посещаемости, и можно было бы радоваться, но видно, что эти «пользователи» не совершают действий, которых от них ждут, неважно что это – изучение контента, или покупки на сайте.
Можно потратить много времени на выяснения причины, а можно просто посмотреть логи доступа и проверить, с каких IP, и кто заходил на ваш сайт, в выбранные промежуток времени. Вполне вероятно, что вы обнаружите большое количество переходов с нескольких IP-адресов, которые делались автоматически, то есть ваш сайт попал под DDoS-атаку.
В этом случае, можно заблокировать доступ к сайту с выбранных IP, и в дальнейшем расширять этот список, при необходимости.
Вывод
На сегодняшний день, log-файлы сервера, являются крайне удобным инструментом, который позволяет отслеживать работу сайта, выявлять баги и ошибки, злонамеренных пользователей, противодействовать DDoS-атакам.
Для того, чтобы правильно работать с логами сервера, необходимо знать их расположение, иметь возможность изучить нужные файлы, а также понимать разные типы записей. В большинстве панелей управления, пользователю сразу предоставляется возможность включать и выключать запись логов. К тому же есть возможность скачивать или просматривать журналы.
Кроме того, сегодня можно найти ряд программного обеспечения, и они позволяют взаимодействовать с информацией из журналов через удобный графический интерфейс, с большой скоростью расшифровывать её и выводить в простом виде.
У систем, основанных на Linux, как правило примерно одинаковое расположение файлов с логами, что существенно упрощает работу с ними.
У Windows Server, есть свой собственный графический интерфейс для чтения логов, который весьма удобен, и позволяет быстро получить необходимую информацию.
 Загрузка…
Apache – the technology that powers the web. I’m not sure if that is correct, but I think that we wouldn’t see the world wide web in its current shape without it. Launched in 1995 and since April 1996, it has been the most popular web server around the world.
Because of handling your users’ requests, Apache serves as the front application. It is crucial to understand what your server is doing, what file users are accessing, from where they came, and much, much more.
The visibility that Apache logs give you is invaluable in understanding the traffic coming to your application, the errors that happen, and the performance of the user-facing elements. Today, we will look into what the Apache web server logs are, how to interpret them, and how to analyze them easily.
What Are Apache Logs?
Apache logs are text files that contain all the information on what the Apache server is doing. They provide insight into which resources were accessed, when they were accessed, who accessed them, and metrics related to that. They also include information about the errors that happened, resource mapping process, the final resolution of the connection, and many, many more.
In general, the whole Apache logging process comes in multiple phases. First, you need to store the logs somewhere for historical analytical purposes. Second, you need to analyze the logs and parse them to retrieve useful information and metrics. And finally, you may want to graph the data as the visual representation is easier to analyze and understand for a human person.
What Is the Apache Access Log?
The Apache access logs are text files that include information about all the requests processed by the Apache server. You can expect to find information like the time of the request, the requested resource, the response code, time it took to respond, and the IP address used to request the data.
Apache Access Logs Location
The location of the Apache server access log differs depending on the operating system that you are using.
- On Red Hat, CentOS, or Fedora Linux, the access logs can be found in the
/var/log/httpd/access_logby default. - On Debian and Ubuntu, you can expect to find the Apache logs in the
/var/log/apache2/access.logand - FreeBSD will have the Apache server access logs stored in
/var/log/httpd-access.logfile.
You can configure its location using the CustomLog directive, for example:
CustomLog "/var/log/httpd-access.log"
Apache Access Log Format Configuration
Before we learn about the different log formats, let’s discuss what the Apache HTTP can do when it comes to formatting. There are two most common access log types that you can use and that the Apache server will translate to meaningful information:
- Common Log Format
- Combined Log Format
The log formatting directives are used in combination with the LogFormat option:
LogFormat "%t %h %m "%r"" custom
The above line tells that the “%t %h %m ”%r”” format should be used and assigned to an alias called custom. After that, we can use the custom alias when defining Apache logging. For example:
CustomLog "logs/my_custom_log" custom
The above section will tell Apache to write logs in the logs/my_custom_log file with the format defined by the custom alias. The above configuration will result in logging:
- time of the request thanks to the %t directive,
- remote hostname thanks to the %h directive,
- HTTP method thanks to the %m directive,
- the first line of the request surrounded by double quotes thanks to the %r directive.
Of course, there are way more directives that can be used and the complete list can be found in the mod_log_config documentation of the Apache server.
Common Log Format
The Apache Common Log Format is one of the two most common log formats used by HTTP servers. You can expect it to see its definition to look similar to the following line:
LogFormat "%h %l %u %t "%r" %>s %b" common
Here’s how an access log from that log file looks like:
10.1.2.3 - rehg [10/Nov/2021:19:22:12 -0000] "GET /sematext.png HTTP/1.1" 200 3423
As you can see the following elements are present:
- %h, resolved into 10.1.2.3 – the IP address of the remote host that made the request.
- %l, remote log name provided by identd, in our case a hyphen is provided, which is a value that we can expect to be logged in a case when the information provided by the logging directive is not found or can’t be accessed.
- %u, resolved into rehg, the user identifier determined by the HTTP authentication.
- %t, the date and time of the request with the time zone, in the above case it is [10/Nov/2021:19:22:12 -0000]
- ”%r”, the first line of the request inside double quotes, in the above case it is: “GET /sematext.png HTTP/1.1”
- %>s, the status code reported to the client. This information is crucial because it determines whether the request was successful or not.
- %b, the size of the object sent to the client, in our case the object was the sematext.png file and its size was 3423 bytes.
Combined Log Format
The Apache Combined Log Format is another format often used with access logs. It’s very similar to the Common Log Format but includes two additional headers – the referrer and the user agent. Its definition looks as follows:
LogFormat "%h %l %u %t "%r" %>s %b "%{Referer}i" "%{User-agent}i"" combined
And the example log line produced by the above log line looks like this:
10.1.2.3 - grah [12/Nov/2021:14:25:32 -0000] "GET /sematext.png HTTP/1.1" 200 3423 "http://www.sematext.com/index.html" "Mozilla/5.0 (Windows NT 10.0; Win64; x64) AppleWebKit/537.36 (KHTML, like Gecko) Chrome/79.0.3945.74 Safari/537.36 Edg/79.0.309.43"
Custom Log Format
There is one more thing that we should discuss when it comes to Apache Server logging configuration – the CustomLog directive. We’ve already seen that configuration directive, but let’s discuss that in greater details.
Multiple Access Logs
It is possible to have multiple Apache access logs at the same time without any additional effort. We may want a limited set of information available in some files for quick scanning and the full log using the Combined Log Format if we need the complete information. For example, we could have three access log files – one that includes time, user agent, and the status code, the second that includes the time, IP address, and referrer used, and the third – the Common Log Format.
To do that we need to include multiple CustomLog sections in our configuration file:
LogFormat "%h %l %u %t "%r" %>s %b" common
CustomLog logs/agent_log "%t %{User-agent}i %>s"
CustomLog logs/referer_log "%t %h %{Referer}i"
CustomLog logs/access_log common
You can see that this time we didn’t use three separate LogFormat configuration options, but we’ve specified the apache log format in the CustomLog format line. This is also possible and very convenient when the formatting of the log lines is used only in that given file.
Conditional Logs
There are cases when you would like to write logs only when a certain condition is met. This is what Apache Server calls conditional logging. It is done by using the CustomLog directive and environment variables. For example, if you would like to log all requests accessing your PNG files in a separate file you can do that the following way:
SetEnvIf Request_URI .png$ png-image-log
CustomLog "png-access.log" common env=png-image-log
Logs Rotation and Piped Logs
Depending on the logging configuration and the traffic that your Apache servers are handling, logging can be extensive. All the logs that you keep on the machine take space and if you are not using a log centralization solution like Sematext Logs, you will have to deal with space and management of logs.
Let’s talk about log rotation first. Log rotation is a process of creating a new log file that the Apache HTTP server will start writing to and renaming the old log file, so it is no longer updated. The log rotation happens when you gracefully restart the server. That means that without any kind of client requests processing interruption a new log file is created. In production environments, you would like to restart the Apache servers though.
That’s why the Apache server supports piped logs. Instead of writing the log events to a file, you use the piped logs to send the log events to a different application that will handle the log processing – for example to rotatelogs:
CustomLog "|/usr/local/apache/bin/rotatelogs /var/log/access.log 86400" common
The rotatelogs application comes with Apache server and is capable of rotating logs without the need of restarting the server. The above example will result in rotating the /var/log/access.log file every 24 hours.
How to Read Apache Access Logs
Apache server access logs are just simple text files. They can be easily opened by any tool that can read such files. On Linux-based systems, this can be the cat command-line tool or tail if you want to monitor the log lines as they go.
There are two caveats, though. The first is access policies. You may not have access to the machines running Apache HTTP server and even if you do, you may not have read access to the appropriate log directories. The second is distribution. It is not uncommon to have multiple Apache servers distributed across multiple data centers. In such a case, it is way easier to use a dedicated observability tool such as Sematext Logs that will provide not only the option to look into the raw files but also aggregated information into the key metrics derived for them.
Understanding Apache Access Logs
Our Apache access logs files are easy to read and not hard to understand either. Just remember about the patterns that you’ve used in your configuration. We’ve already covered the common patterns that you can encounter in the Apache log files. Keep in mind that understanding the log files is even easier with log analysis tools that do the parsing for you and give you an aggregated view of the data which is easier to understand.
What Is the Apache Error Log?
So far, we’ve talked about the Apache access log that gives us information on the accessed resources. But it is not the only thing that we should be interested in. We should also care about everything related to errors. In fact, the error log is the most important log file for the Apache HTTP server.
The Apache error log is where all the errors that happened during the processing of the requests. The most important thing, though, is that the error log will contain information on what went wrong during the Apache server startup and it is very likely that it will also contain hints on how to fix the issue.
Apache Errors Logs Location
Where the Apache error log is stored differs depending on the operating system on which it is running.
- On Red Hat, CentOS, or Fedora Linux, the access logs can be found in the
/var/log/httpd/error_logby default. - On Debian and Ubuntu, you can expect to find the Apache logs in the
/var/log/apache2/error.log - FreeBSD will have the Apache server access logs in
/var/log/httpd-error.logfile.
You can configure its location using the ErrorLog directive, for example:
ErrorLog "/var/log/httpd-error.log"
Apache Error Log Format Configuration
Similar to the Apache access log, you can adjust the format of the error log. The Apache error log format is configured by using the ErrorLogFormat element, for example:
ErrorLogFormat “[%{u}t] [%-m:%l] [pid %P:tid %T] [client %a] %M”
The above configuration would produce an Apache error log entry similar to the following one:
[Wed Nov 10 10:21:23.811033 2021] [core:error] [pid 22308:tid 3212342123] [client 10.1.2.3] File does not exist: /usr/local/apache2/htdocs/favicon.ico
In the above example the following formatting options were used:
- %{u}t – the current time including microseconds,
- %-m – the module that produced the error,
- %l – the level of the log event,
- %P – process identifier,
- %T – thread identifier,
- %M – the actual log message.
The full description of the available formatting options is available in the official Apache Server documentation.
Log Levels
In addition to what we discussed so far there is one other thing worth mentioning – the level of log events. The LogLevel directive allows specifying the level of log messages on a per-module basis. For example, if we would like the main log level for all events to be set to the info level but have the error level only for the rewrite module, we could have a configuration directive as follows:
LogLevel info rewrite:error
The following logging levels are described in Apache server documentation:
- emerg
- alert
- crit
- error
- warn
- notice
- info
- debug
- trace1 – trace8
The emerg one is the log event that says that the system is unstable and the trace levels are used for very low-level information logging that you can probably skip.
How to View Apache Error Logs
Viewing the Apache server error logs is just as simple as opening the text file. The error logs are not different from the access logs, so they are just simple text files. You can use whatever tools you want to look into them. But keep in mind that looking into logs from multiple Apache servers distributed across multiple data centers can be challenging. That’s why we strongly suggest using log aggregation tools, such as Sematext Logs, for that job.
Apache Log File Management and Analysis with Sematext
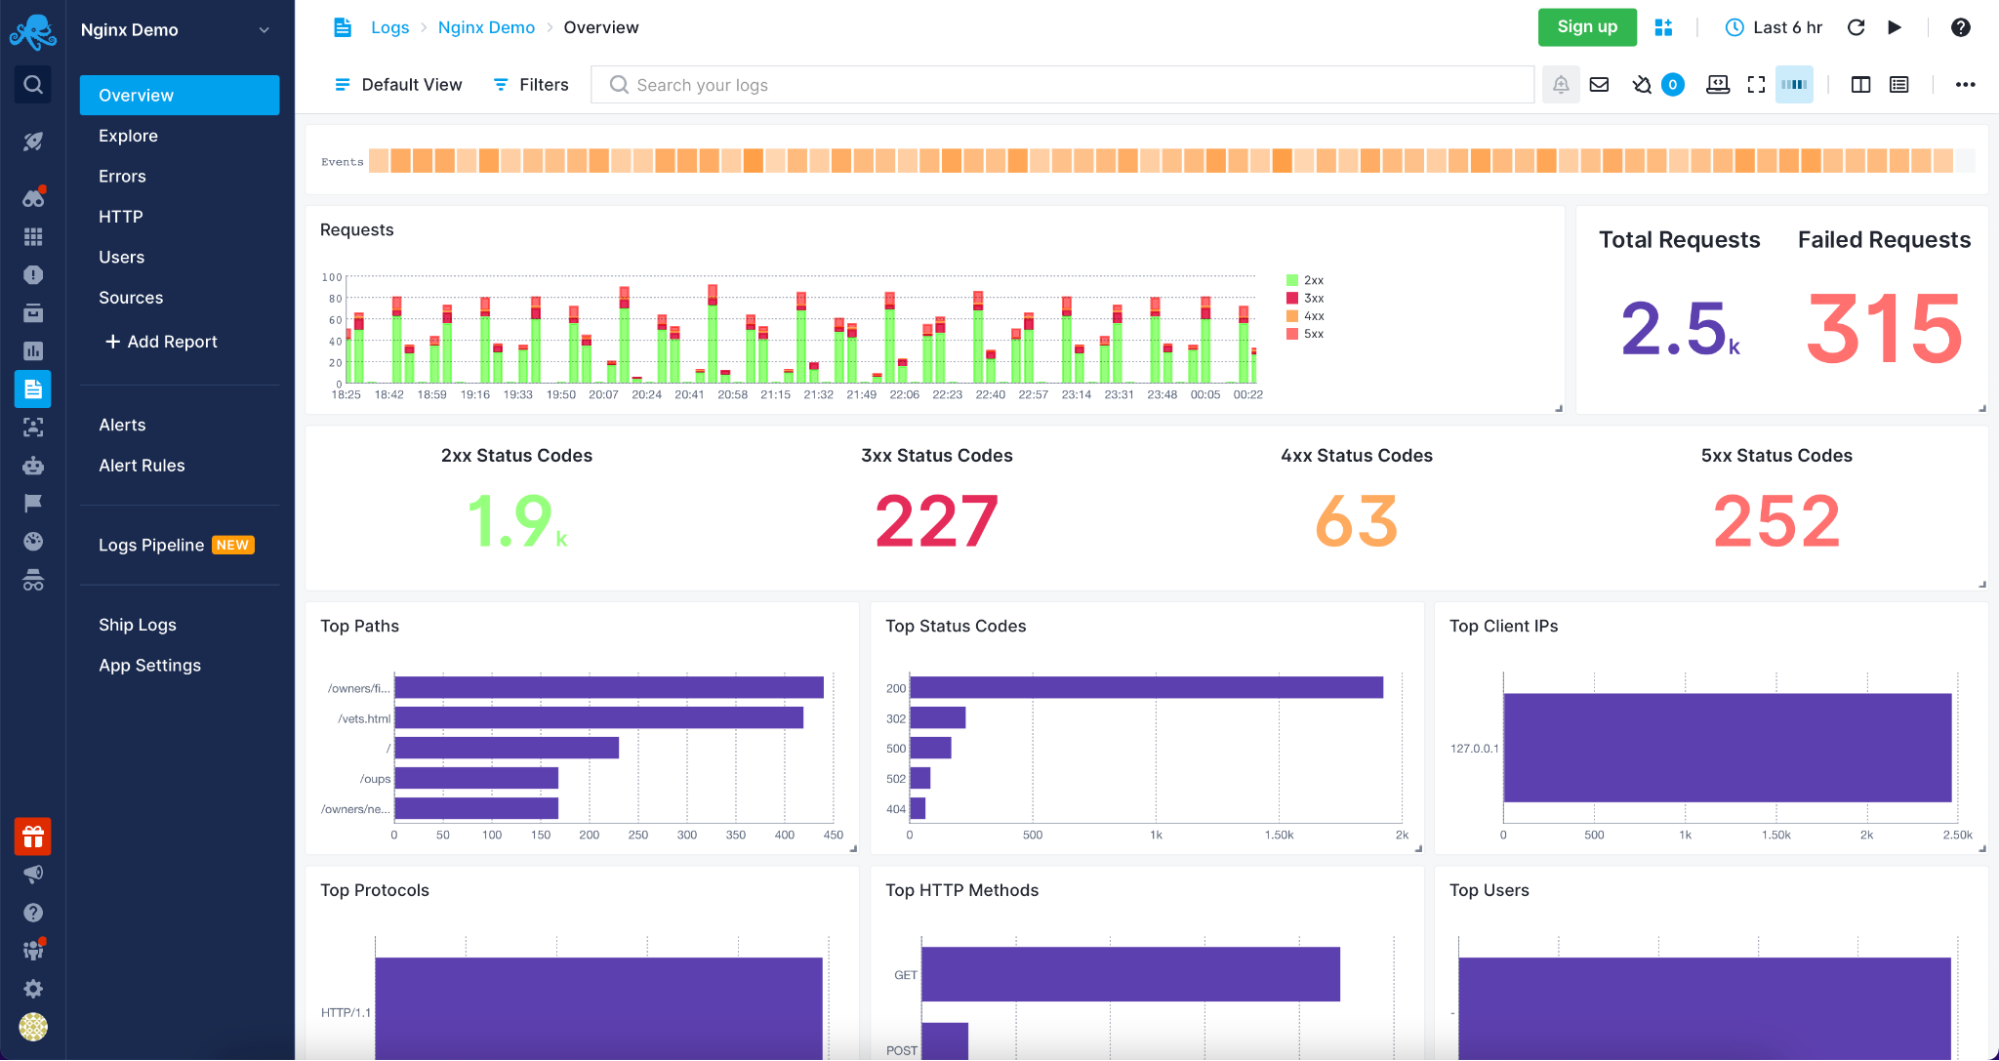
Sematext Cloud Logs – Apache Overview
Understanding and analyzing your Apache servers logs was never easier than with Sematext Logs. The only thing that you need to do is create an account with Sematext, create the Apache Logs App and install the Sematext Agent. You will be guided through the process of setting up the automatic Logs Discovery for your Logs. Your logs will be parsed and sent to the Sematext Logs giving you access to a variety of pre-built reports tailored for your Apache HTTP server.
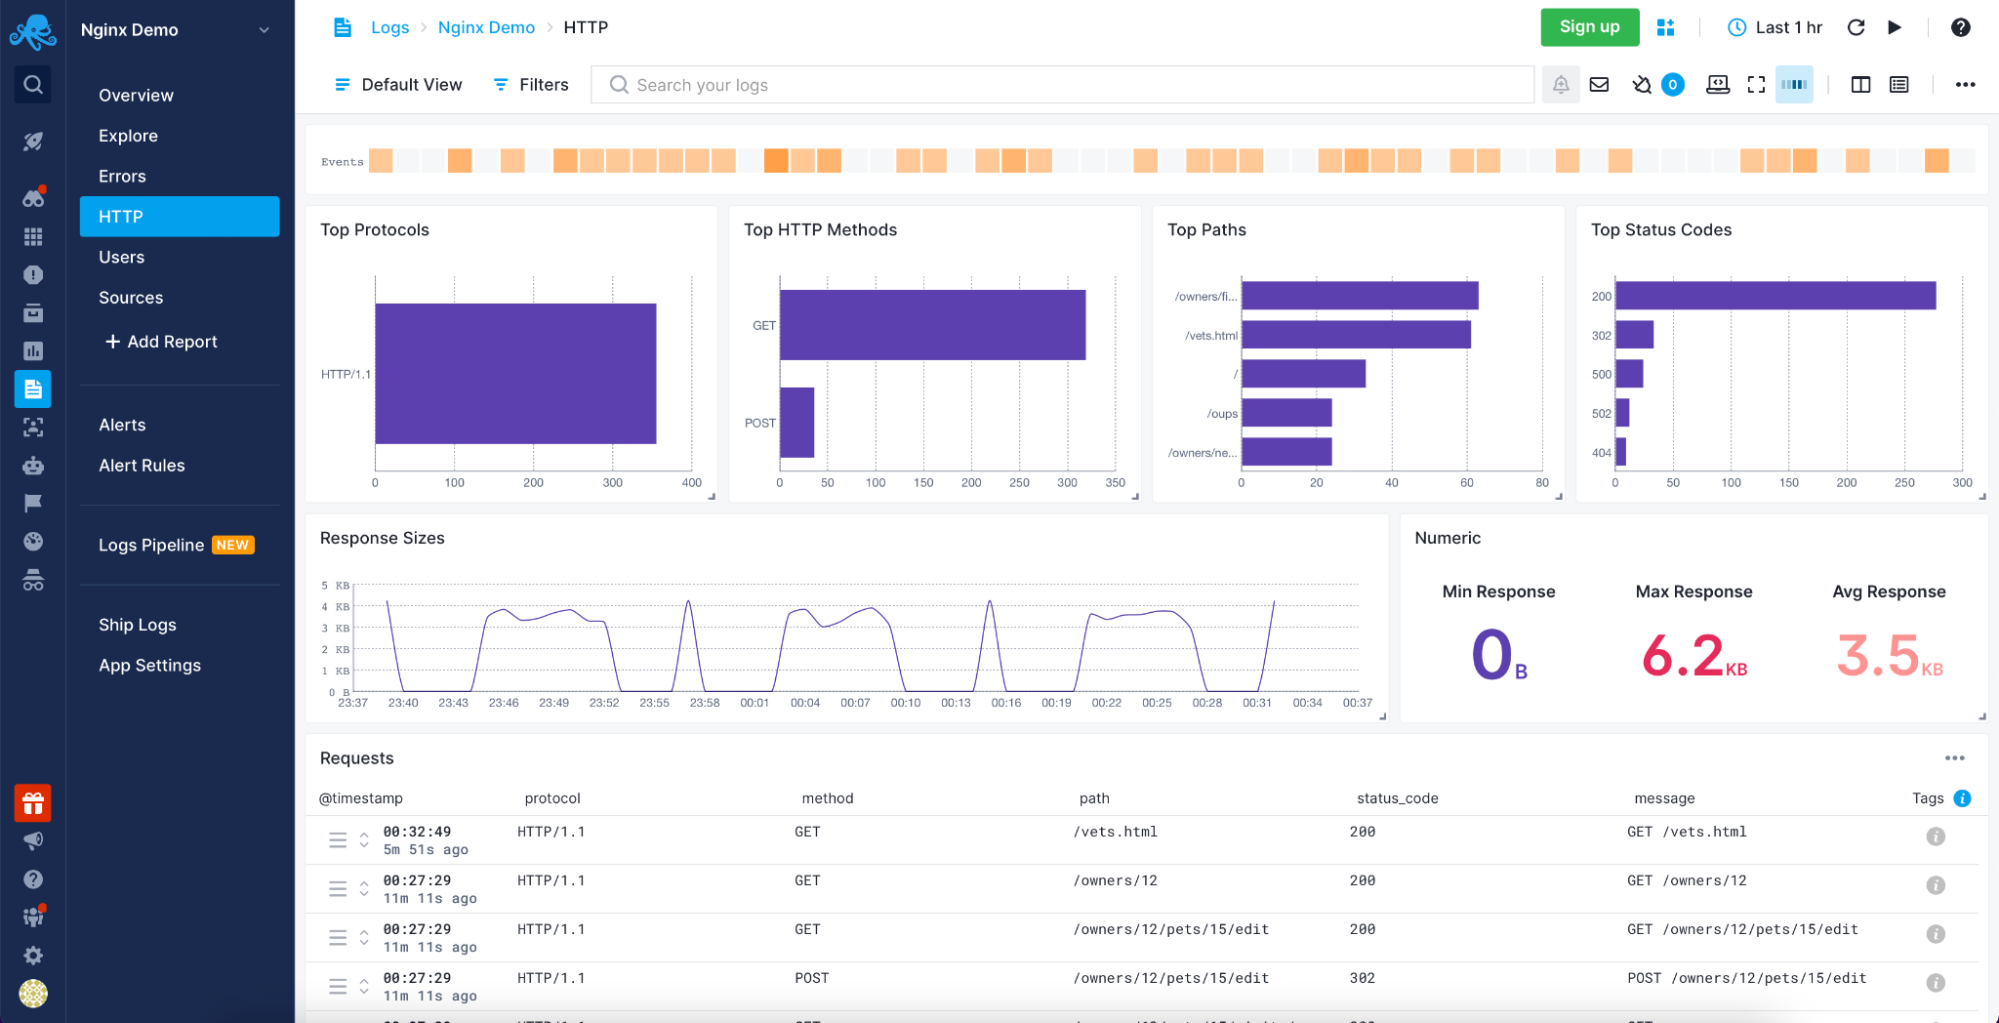
Sematext Logs – Apache HTTP Information
Sematext Logs is part of the Sematext Cloud full-stack monitoring solution providing you with all you need when it comes to observability. With Sematext Cloud, you get an overview of your Apache servers, errors report, HTTP report, including top HTTP methods and paths with an average response size visualization and requests table. You can see your users with the top User Agents used to access resources served by your Apache servers and, finally, the sources for the data. All within a single Apache Logs monitoring in Sematext Cloud.
Still not sure which open-source search engine to use? Check out this quick video comparing Apache Solr and Elasticsearch below:
Conclusion
Analyzing your Apache servers logs is invaluable in understanding the traffic coming to your application, the errors that happen, and the performance of the user-facing elements. A log management tool such as Sematext Logs does this job for you.
More than understanding server logs, knowing what resources were accessed, who accessed them, and how long it took to process the request is crucial to understanding your user’s behavior. You also need to be sure that you are aware of every error that happens so that you can react as soon as possible. Combining that with the need for distributed infrastructures to handle a large number of concurrent users and provide high availability, using an observability tool is a necessity.
Having Apache metrics and logs in the same place, being able to slice and dice them, being alerted when issues appear and having insight into every piece of your environment is no longer something good to have but need to have. All of that and more is provided by Sematext Cloud, an observability platform with dedicated Apache server logs and metrics support. Built with simplicity in mind and requiring no credit card, nothing stops you from giving it a try to see how it can improve your log management and log analysis processes.