Пересказ статьи Rajendra Gupta. How to manage SQL Server logs effectively
В статье дается обзор журналов SQL Server для управления и устранения неполадок на сервере.
Введение
Журналы являются лучшим средством администратора баз данных при решении любых проблем. Эти проблемы могут быть связаны с конфигурацией сервера, запуском, восстановлением, производительностью, флагами трассировки, тупиковыми ситуациями, вводом-выводом или задержками. Предположим, например, что ваш экземпляр SQL Server перезапускается по непонятным причинам, и после перезапуска службы SQL работают, однако ваше приложение не имеет доступа к базе данных. Таким образом, для исследования проблемы вам нужно заглянуть в последний журнал SQL Server, чтобы проконтролировать процесс восстановления базы данных и узнать оценку времени его завершения.
Администратор базы данных может также сконфигурировать SQL Server для выполнения дополнительных записей в журналы ошибок. Например, мы можем включить флаг трассировки для захвата информации о тупиковых ситуациях. DBA должен регулярно просматривать эти журналы в поисках потенциальных проблем. Вы можете обнаружить в журналах такую информацию, как сбой резервного копирования, ошибки входа, ошибки ввода-вывода. Эти журналы ошибок являются отличным средством для обнаружения существующих и потенциальных проблем в экземплярах SQL Server.
Журналы SQL Server известны как SQL Server Error logs. Журналы ошибок содержат информационные сообщения, предупреждения и сообщения о критичных ошибках. Вы можете просматривать некоторые из этих журналов также в просмотрщике событий Windows. Однако рекомендуется использовать журналы SQL Server для получения подробной информации.
Журналы SQL Server и их местонахождение
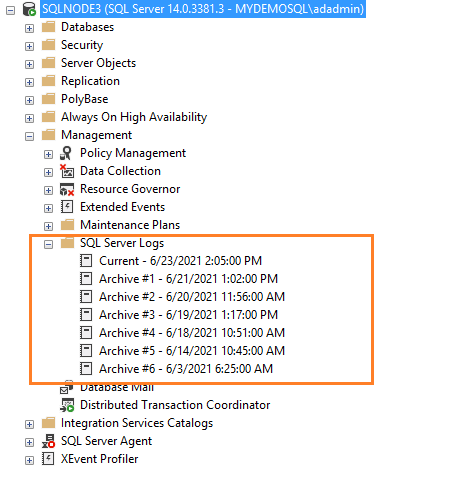
Если вы подключены к экземпляру SQL Server в SSMS, перейдите к Management -> SQL Server Logs. Как показано ниже, имеется текущий журнал и шесть архивных журналов (Archive#1 — Archive #6).
Метод 1: Использование расширенной процедуры xp_readerrorlog
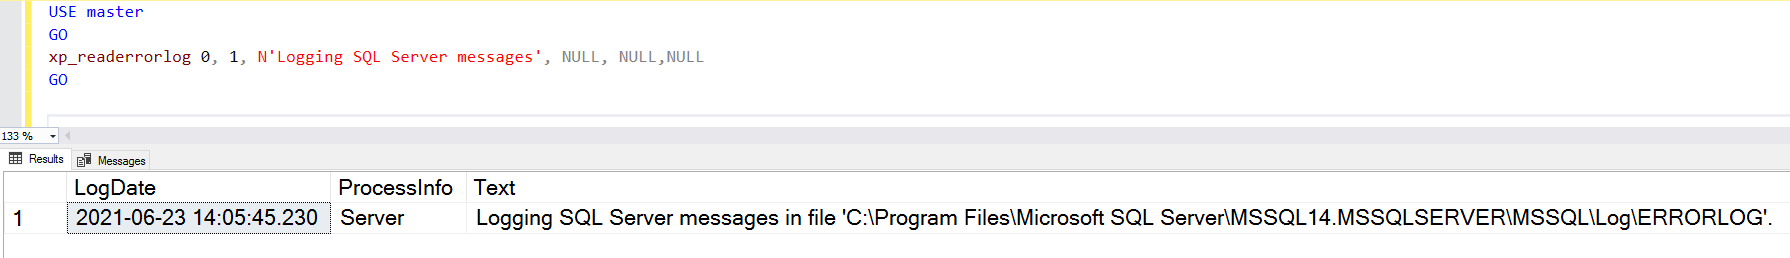
Текущие журналы являются самыми последними файлами журнала ошибок, и вы можете использовать их для просмотра недавней деятельности с момента запуска SQL Server или ручного перезапуска файла журнала. Журнал ошибок SQL Server является текстовым файлом, хранящимся в каталоге журналов экземпляра SQL Server. Вы можете использовать расширенную процедуру xp_readerrorlog для нахождения текущего местоположения журнала ошибок.
USE master

GO

xp_readerrorlog 0, 1, N'Logging SQL Server messages', NULL, NULL,NULL

GO
Этот запрос имеет следующие параметры:
- Файл журнала ошибок: значение 0 для текущего, 1 для Archive#1, 2 для Archive #2.
- Тип файла журнала: значение 0 для журнала ошибок SQL Server, 1 для агента SQL Server.
- Строка поиска 1
- Строка поиска 2
- Время от
- Время до
- Сортировка результатов — по возрастанию (N’ASC) или по убыванию (N’Desc)
Для моего демонстрационного экземпляра файл журнала ошибок находится в папке C:Program FilesMicrosoft SQL ServerMSSQL14.MSSQLSERVERMSSQLLogERRORLOG.
Метод 2: Использование функции SERVERPROPERTY()
Мы можем использовать в запросе функцию SERVERPROPERTY, и также определить местонахождение SQL Server ERRORLOG.
SELECT SERVERPROPERTY('ErrorLogFileName') AS 'Error log location'

Метод 3: использование менеджера конфигурации SQL Server
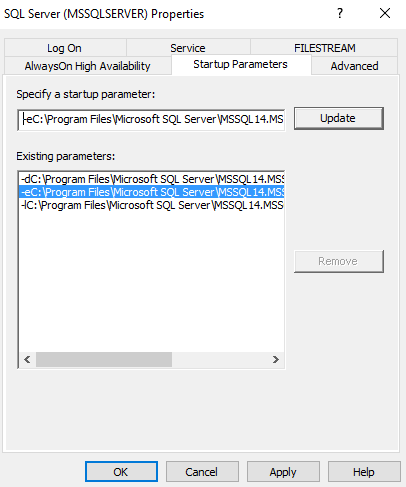
Откройте SQL Server Configuration Manager и посмотрите параметры запуска. Местоположение файлов журнала указывается с помощью переключателя -e.
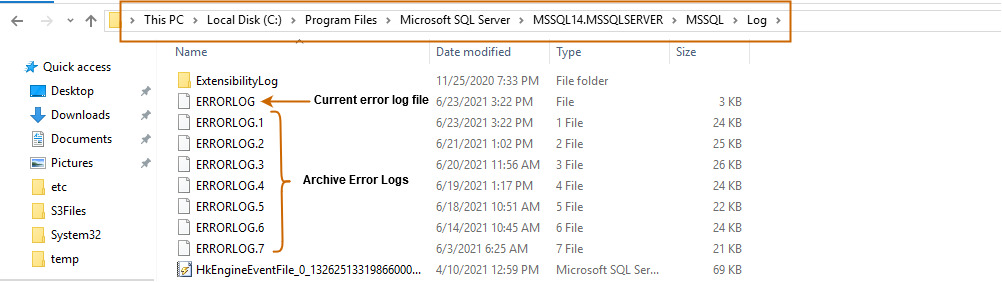
Вы можете развернуть каталог журналов и просмотреть текущий или архивные файлы журнала. Эти журналы ошибок можно открыть в текстовом редакторе, таком как Notepad или Visual Studio Code.
Конфигурирование числа файлов журнала SQL Server и их размеров
По умолчанию SQL Server поддерживает текущий и 6 архивных файлов журнала. Чтобы уточнить значение, выполните щелчок правой кнопкой на папке SQL Server Logs в SSMS и выберите Configure.
SQL Server записывает всю информацию в текущий файл журнала, независимо от размера файла журнала. В загруженной системе или в экземпляре с большим количеством ошибок вам может быть сложно просмотреть файл журнала в SSMS. SQL Server создает новый файл журнала и архивирует текущий файл в следующих случях.
- При перезапуске службы SQL.
- При перезагрузке журнала ошибок вручную.
Однако если вы часто перезапускаете серверы по неизвестным причинам, то можете потерять все исторические данные в архивных журналах, поскольку их поддерживается только шесть. Поскольку ошибки содержат ценную информацию, которая может помочь в решении проблем, вы можете не захотеть потерять эти важные данные. Тогда, возможно, вы захотите сохранять файлы журнала производственной системы в течение недели или даже месяца.
SQL Server позволяет сконфигурировать от 6 до 99 файлов журнала ошибок. Вы не можете указать значение меньше шести, поскольку в любом случае будет поддерживаться шесть архивных журналов ошибок.
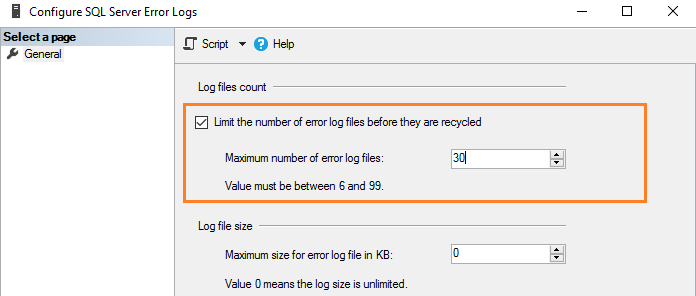
Для изменения значения по умолчанию числа файлов журнала ошибок поставьте галочку в поле с названием “Limit the number of error log files before they are recycled”. Например, следующий скриншот показывает максимальное число файлов журнала ошибок, равное 30.
Это эквивалентно выполнению скрипта T-SQL, который использует расширенную хранимую процедуру и обновляет значение регистра.
USE [master]

GO

EXEC xp_instance_regwrite N'HKEY_LOCAL_MACHINE', N'SoftwareMicrosoftMSSQLServerMSSQLServer', N'NumErrorLogs', REG_DWORD, 30

GO
Замечание. Следует перезапустить службу SQL, чтобы изменения вступили в силу.
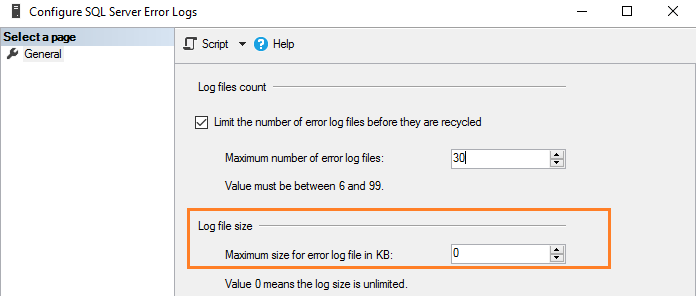
Как утверждалось ранее, по умолчанию размер журнала ошибок не ограничен. Например, если вы не запускаете SQL Server в течение длительного периода и вручную не перегружаете файлы журнала, этот файл вырастет до громадных размеров. Поэтому в конфигурации журнала ошибок показано значение 0, соответствующее неограниченному размеру журнала.
Вы можете задать размер в Кб для ограничения размера журнала ошибок в соответствии с вашими требованиями. Например, здесь мы ограничиваем размер файла журнала в 1Гб.
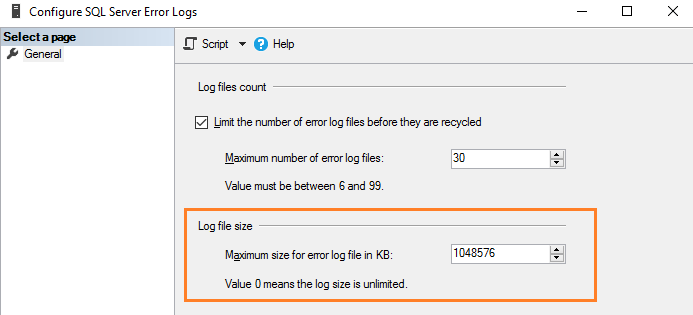
Эквивалентный скрипт T-SQL обновляет ErrorLogSizeInKb в регистре SQL Server.
USE [master]

GO

EXEC xp_instance_regwrite N'HKEY_LOCAL_MACHINE', N'SoftwareMicrosoftMSSQLServerMSSQLServer', N'ErrorLogSizeInKb', REG_DWORD, 1048576

GO
Перезагрузка журналов ошибок вручную
SQL Server позволяет вручную перегружать журналы ошибок для эффективного управления ими. Например, предположим, что вы увеличили число файлов журнала ошибок до 30. Тогда мы можем создать задание для агента SQL Server, который перегружает журналы ошибок в полночь. Тем самым мы имеем файл журнала ошибок на каждый день, если SQL Server не будет перезапущен в этом промежутке. Для перезагрузки вручную выполните системную хранимую процедуру sp_cycle_errorlog. Эту процедуру может выполнить пользователь с фиксированной серверной ролью sysadmin.
EXEC sp_cycle_errorlog

GO
Файл журнала SQL Server Agent
Агент SQL Server также имеет отдельный журнал ошибок, подобный журналам SQL Server. Вы можете обнаружить его в папке SQL Server Agent – > Error logs.
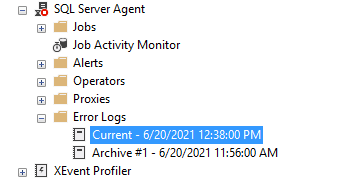
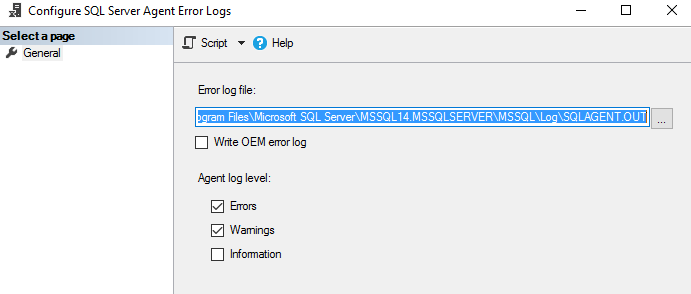
Щелкните правой кнопкой на папке Error log и выберите команду Configure. Это даст местоположение журнала ошибок агента и уровень журнала агента.
Файл журнала агента имеет расширение *.OUT и хранится в папке log при конфигурации по умолчанию. Например, в моей системе файл журнала находится здесь: C:Program FilesMicrosoft SQL ServerMSSQL14.MSSQLSERVERMSSQLLogSQLAGENT.OUT.
По умолчанию в файл журнала записываются ошибки и предупреждения; однако мы можем включить информационные сообщения:
- Предупреждения: Эти сообщения предоставляют информацию о потенциальных проблемах. Например, “Job X was deleted while it was running” (задание Х было удалено во время выполнения).
- Сообщение об ошибках: оно дает информацию, которая требует немедленного вмешательства администратора баз данных, например, невозможность почтового сеанса.
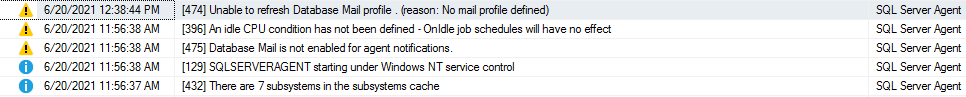
Чтобы добавить информационное сообщение, поставьте галочку в поле Information.
SQL Server использует до 9 файлов журнала агента SQL Server. Имя текущего файла SQLAGENT.OUT. Файл с расширением .1 указывает на первый архивный журнал ошибок агента. Аналогично расширение .9 указывает на 9-й (самый старый) архив журнала ошибок.
Файлы журнала агента SQL Server перегружаются всякий раз, когда перезапускается SQL Server Agent. Для того, чтобы сделать это вручную, выполните щелчок правой кнопкой на папке Error Logs folder и выберите Recycle.
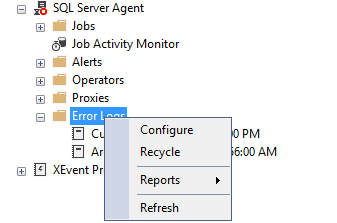
Или используйте хранимую процедуру sp_cycle_agent_errorlog для перезагрузки файлов журнала агента SQL Server вручную.
USE msdb ;

GO

EXEC dbo.sp_cycle_agent_errorlog ;

GO
Хранимая процедура архивирует текущий журнал ошибок агента, используя следующий процесс:
- Создается новый текущий журнал ошибок агента.
- Текущий журнал ошибок SQLAgent.out преобразуется в SQLAgent.1.
- SQLAgent.1 преобразуется в SQLAgent.2
Заключение
Файл журнала ошибок SQL Server содержит информацию, предупреждения и критические сообщения экземпляра. Это полезно для решения проблем, аудита входа (успешно, отказ). Администратор базы данных может сконфигурировать требуемое число архивных журналов ошибок и каталогов для хранения этих файлов.
Вы должны регулярно просматривать записи в журнале в качестве подготовки ежедневных или еженедельных отчетов о состоянии сервера.
 Автор: Alexey Knyazev
 Автор: Alexey Knyazev
Сегодня я расскажу про недокументированные расширенные хранимые процедуры (Extended Stored Procedures) для работы с журналом ошибок SQL Server и SQL Server Agent.
На самом деле при просмотре журнала SQL Server Logs через SSMS (SQL Server Management Studio) идёт обращение именно к этим двум основным процедурам (xp_readerrorlog и xp_enumerrorlogs), хоть и не на прямую, а через системные интерфейсные процедуры.
Особое внимание я уделю описанию входных параметрам этих недокументированных процедур.
И так, что же происходит, когда мы просматриваем журнал ошибок через SSMS?

Во первых мы определяем путь к нашей папке с журналами
|
select ServerProperty(‘ErrorLogFileName’) |

Затем выводим информацию о текущем журнале и о шести предыдущих
|
exec master.dbo.sp_enumerrorlogs |

в качестве входного параметра можно указать
- 1 — Список журналов SQL Server (значение по умолчанию)
- 2 — Список журналов SQL Server Agent
Если обратиться к тексту этой процедуры, то можно увидеть, что это не более, чем «обёртка» для вызова другой процедуры
|
create proc sys.sp_enumerrorlogs( @p1 int = 1) as begin IF (not is_srvrolemember(N‘securityadmin’) = 1) begin raiserror(15003,—1,—1, N‘securityadmin’) return (1) end exec sys.xp_enumerrorlogs @p1 end |
По коду процедуры видно, прежде чем обратиться к расширенной хранимой процедуре xp_enumerrorlogs, идёт проверка, что пользователь входит в серверную роль securityadmin.
Теперь если мы нажмём View SQL Server Log

то мы сможем просмотреть все события выбранного журнала:

В этот момент идёт обращение к ещё одной процедуре-обёртке master..sp_readerrorlog.
Ниже текст этой процедуры:
|
1 2 3 4 5 6 7 8 9 10 11 12 13 14 15 16 17 18 19 |
create proc sys.sp_readerrorlog( @p1 int = 0, @p2 int = NULL, @p3 nvarchar(4000) = NULL, @p4 nvarchar(4000) = NULL) as begin if (not is_srvrolemember(N‘securityadmin’) = 1) begin raiserror(15003,—1,—1, N‘securityadmin’) return (1) end if (@p2 is NULL) exec sys.xp_readerrorlog @p1 else exec sys.xp_readerrorlog @p1,@p2,@p3,@p4 end |
Как вы видите у неё четыре входных параметра:
- @p1 — номер журнала (0-6); 0 — текущий
- @p2 — чей журнал; 1 — SQL Server, 2 — SQL Server Agent
- @p3 — фильтр для поиска
- @p4 — второе условие для поиска
Пример:
|
exec master.dbo.sp_readerrorlog 0, 1, N‘error’ |

|
exec master.dbo.sp_readerrorlog 0, 1, N‘error’, N‘34050’ |

Но это ещё не всё. Если обратиться к самой расширенной процедуре xp_readerrorlog, то у неё есть ещё несколько параметров:
- @p5 — условие с какой даты выводить результат
- @p6 — условие до какой даты выводить результат из журнала
- @p7 — тип сортировки (asc/desc)
- @p8 — экземпляр SQL Server (@InstanceName), параметр появился в SQL Server 2012
Пример:
|
exec master.dbo.xp_readerrorlog 0, 1, null, null, ‘20130418’, ‘20130419’ |

|
exec master.dbo.xp_readerrorlog 0, 1, null, null, ‘20130418’, ‘20130419’, N‘desc’ |

Если необходимо работать с журналом пользователю с минимальными привилегиями, то достаточно дать явные права на эти расширенные процедуры, но обращаться к ним придётся через запросы, т.к. SSMS использует интерфейсные процедуры, которые проверяют входимость пользователя в группу securityadmin.
|
use master go grant execute on xp_readerrorlog to [Ваш юзер] go |
Запись опубликована в рубрике В помощь администратору с метками error log. Добавьте в закладки постоянную ссылку.
В процессе функционирования SQL Server ведет журнал, в котором регистрирует события, связанные с работой сервера. В документации этот журнал называется Error Log, что не вполне соответствует действительности. Правильнее было бы именовать его Event Log, так как в нем отмечается множество событий различного характера из разных источников, включая системные информационные и системные аварийные события, сообщения аудита регистрации и пользовательские сообщения (если сравнивать с операционной системой, то в Windows NT/2000 события регистрируются в трех журналах — Application, Security и System).
В документации по SQL Server отсутствует систематизированное изложение вопросов, связанных с Error Log, — сведения разбросаны по разным разделам, а часть информации, относящаяся к применению Transact SQL при работе с журналом, и вовсе отсутствует. Данная статья призвана в какой-то мере восполнить этот пробел в документации и помочь администраторам баз данных и разработчикам приложений научиться полностью использовать возможности журнала Error Log.
Что такое Error Log
При каждом запуске SQL Server начинает новый журнал Error Log, который представляет собой текстовый файл, расположенный по умолчанию в каталоге MSSQLLog. Файлы журналов, созданные при предыдущих запусках, не удаляются, а просто переименовываются. Текущий файл журнала имеет имя Error Log, файл предыдущего запуска Error Log.1 и т. д. По умолчанию SQL Server хранит файлы шести предыдущих журналов. Проще всего просмотреть журналы в Enterprise Manager (см. Рисунок 1). Изменить местоположение файлов журнала можно, используя параметр -e при старте сервера. В Enterprise Manager это делается через контекстное меню SQL Server properties: закладка General — Startup Parameters (см. Рисунок 2).

|
Рисунок 2. Установка параметров запуска SQL Server. |
Число сохраняемых журналов устанавливается в Enterprise Manager c помощью контекстного меню SQL Server Logs Configure (см. Рисунок 3). Можно сохранять не более 99 журналов предыдущих запусков.
|
|
Рисунок 3. Установка параметров Error Log. |
При запуске SQL Server в журнал заносится следующая информация:
- дата и время запуска;
- используемые версии SQL Server и Windows NT/2000 с учетом Service Pack;
- системный приоритет SQL Server и число процессоров в системе;
- информация о подключении системных и пользовательских баз данных;
- используемые сетевые библиотеки;
- сведения о готовности SQL Server к работе с клиентскими соединениями.
Если при запуске SQL Server возникли проблемы, можно с помощью любого текстового редактора прочитать файл Error Log и, возможно, обнаружить причину неудачи. При завершении работы сервер записывает в журнал причину этого события — либо была остановлена служба MSSQLSERVER (Server shut down by request), либо прекращена работа операционной системы (SQL Server terminating because of system shutdown). Если таких сообщений нет (естественно, не в текущем журнале), это означает, что работа компьютера не была завершена должным образом, например по причине аппаратного сбоя. Есть еще одно сообщение, которое может быть последним в Error Log, — в случае если был принудительно открыт новый файл журнала (Attempting to cycle errorlog). Об этом мы поговорим позже.
Необходимо отметить, что по умолчанию все сообщения Error Log дублируются в журнале Windows Application Log. Двойную регистрацию событий можно отменить, запустив SQL Server с параметром -n. При этом нужно обязательно указать параметр -e, иначе события не будут записываться и в журнал Error Log.
Какие события отражаются в Error Log
Есть события, которые в обязательном порядке отражаются в журнале.
К ним относятся:
- копирование/восстановление базы данных;
- нехватка дискового пространства в базе данных;
- выполнение команды KILL.
Можно организовать аудит удачных и неудачных попыток регистрации пользователей. В Enterprise Manager это делается с помощью контекстного меню SQL Server Properties: закладка Security — Audit Level (см. Рисунок 4).
|
|
Рисунок 4. Установка аудита регистрации пользователей. |
Как записывать собственные сообщения в Error Log
Собственные сообщения можно записать в журнал с помощью оператора RAISERROR или хранимой процедуры xp_logevent.
В RAISERROR для записи в журнал используется параметр WITH LOG :
RAISERROR ('Ошибка при добавлении
данных!',10,1) WITH LOG
Хранимая процедура xp_logevent специально предназначена для записи сообщений в Error Log:
exec master..xp_logevent 60000,
?посылка почты?,ERROR
Первый параметр — код сообщения, он должен быть больше 50 000. Последний параметр может принимать значения INFORMATIONAL, WARNING или ERROR. Необходимо обратить внимание на то, что xp_logevent, в отличие от RAISERROR, не посылает сообщение клиентской программе и не изменяет значения глобальной переменой @@ERROR. Для xp_logevent также нужна настройка прав на выполнение.
Хранимые процедуры для работы Error Log
Хранимая процедура sp_enumerrorlogs служит для получения полного списка журналов с указанием даты окончания записи в них и их объема. Хранимая процедура sp_readerrorlog читает журнал с указанным номером. Если номер не указан или номер 0, читается текущий журнал. Результаты выполнения названных процедур приведены на Рисунке 5.
Обе процедуры возвращают в качестве результата таблицы, структуры которых приведены ниже при описании примера работы с Error Log. Хранимая процедура sp_cycle_errorlog служит для принудительного открытия нового файла журнала. Необходимость открыть новый файл журнала может быть вызвана, например, большим объемом текущего журнала в результате длительной непрерывной работы сервера (журнал большого объема трудно просматривать и анализировать).
Пример практического использования знаний об Error Log
Администратор базы данных должен знать, как часто происходит запуск и остановка SQL Server. Особенно эта информация полезна, если сервер физически расположен не в организации, а у провайдера услуг. При этом желательно знать общее время работы сервера и причины остановки. Сценарий, приведенный в Листинге 1, решает эту задачу, используя информацию из Error Log.
Итог исполнения сценария на тестовом сервере приведен на Рисунке 6. Здесь показано, что первый, второй, пятый и шестой журналы были закрыты по причине остановки Windows, третий журнал — в результате остановки службы SQL Server, а четвертый — принудительно хранимой процедурой sp_cycle_errorlog.
В текущем журнале последним событием является попытка неудачной регистрации пользователя.
Ильдар Даутов — MCT, MCDBA, начальник отдела АКБ «Заречье», dia@zarech.ru.
Что такое ERRORLOG?! Некоторые специалисты, которые
сопровождают MS SQL Server первый раз слышат о нем или не подозревают, что он есть.
ERRORLOG – это
журнал MS SQL Server,
физически это текстовый файл. По умолчанию он находится в каталоге установке SQL Server в
папке Log, к примеру, в
«C:Program FilesMicrosoft SQL Server
MSSQL13.SQL2016 MSSQLLog». В нем регистрируются как информационные сообщения,
ошибки различной серьезности, пользовательские ошибки информация по dump-ам sql server и другая полезная
инфомарция, хотя бывает и не очень полезная.
Журнал создается каждый раз при
запуске службы SQL Server,
количество их регулируется настройками в SQL Server, желательно указывать 10 или более на важных системах, т.к при установке
обновлений, проблемах при нескольких попытках старта SQL Server, они перезаписываются
и в итоге вы можете потерять важную информацию при диагностике сервера.
Даже при установке обновлений SQL Server, происходит несколько рестартов
служб, что так же создает новый журнал.
В данный журнал записывается
информация как об ошибках работы сервера, информация о sql дампах,
безопасности, так и информация информационного характера.
Журналы можно просмотреть несколькими способами:
1.
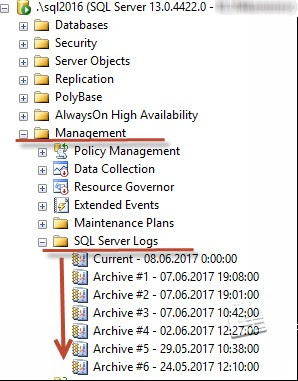
Через SQL Server Management Studio, вкладка Management -> SQL Server Logs, дважды щелкнув на нужный файл.
2.
Открыть текстовым любым текстовым редактором из
каталог Log.
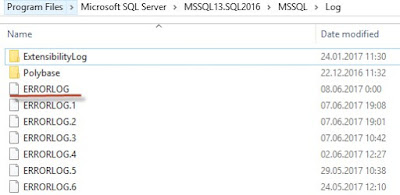
Текущий всегда будет без
расширения и с именем ERRORLOG,
далее по возрастанию от 1 и выше, 1 это предпоследний.
3.
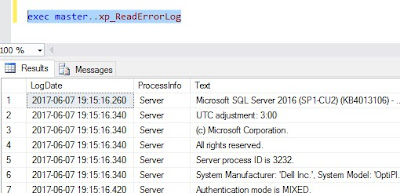
Использовать хранимую процедуру.
exec master..xp_ReadErrorLog
Когда журнал большой, лучше его отфильтровать, к примеру
таким способом, меню Filter в Log File Viewer:

Или через T-SQL:
create table #t
( logdate datetime,
processinfo char(15),
text nvarchar(max)
)
insert into #t
exec xp_ReadErrorLog
select * from #t where text like‘%Error%’
drop table #t
Если сервер давно не
перезагружали или сервер имел много событий, файл журнала событий может вырасти
в размере и открытие его будет проблематичным. В данном случае, активный журнал
можно пересоздать командой:
EXEC sp_cycle_errorlog
После этого создастся новый
текущий журнал, а в файле отразится информация вида:
Attempting to cycle error log. This
is an informational message only; no user action is required.
The error log has been
reinitialized. See the previous log for older entries.
Чтобы держать файлы в порядке и
читабельными, желательно указанную команду прописать в sql задание на
раз в месяц.
Итак, что говорит нам SQL Server Log?
Возьмем, для примера, файл с
одного с рабочих серверов:
2017-06-18
12:26:50.31 Server Microsoft SQL
Server 2016 (SP1-CU3) (KB4019916) — 13.0.4435.0 (X64)
Apr 27 2017 17:36:12
Copyright
(c) Microsoft Corporation
Enterprise Edition: Core-based
Licensing (64-bit) on Windows Server 2016 Datacenter 6.3 <X64> (Build
14393: )
Сразу можно определить версию SQL Server, установленные
обновления и ОС, время старта SQL Server.
Довольно часто, обновления не ставят на сервер, но имеют проблемы. Как-то обратился клиент,
у него имелось куча проблем, попросил данный журнал SQL server, а у них версия SQL server 2008R2 RTM, при том что за окном уже SQL версии 2017 на подходе. Первое
рекомендация и необходимость дальнейшей работы – установить обновления
последния.
2017-06-18
12:26:50.32 Server UTC adjustment:
3:00
Локальное время на сервере.
2017-06-18
12:26:50.32 Server (c) Microsoft
Corporation.
2017-06-18
12:26:50.32 Server All rights
reserved.
2017-06-18
12:26:50.32 Server Server process ID
is 8112.
2017-06-18
12:26:50.32 Server System
Manufacturer: ‘FUJITSU’, System Model: ‘PRIMERGY RX4770 M3’.
Вендор и модель сервера, тоже
важно. При виртуализации это здесь так же видно.
2017-06-18
12:26:50.32 Server Authentication
mode is MIXED.
Вид аутефикации на сервере — здесь
смешанная.
2017-06-18
12:26:50.32 Server Logging SQL
Server messages in file ‘C:SQLMSSQL13.MSSQLSERVERMSSQLLogERRORLOG’.
Каталог расположения этого самого журнала.
2017-06-18
12:26:50.32 Server The service
account is ‘ADSQL_USER’. This is an informational message; no user action is
required.
Учетная запись, под которой
работает служба SQL Server. Сразу и легко определяес под кем работает служба,
далее можно у админов ОС запросить проверку прав в ОС или что-то подобное.
2017-06-18
12:26:50.32 Server Registry startup
parameters:
-d
C:SQLMSSQL13.MSSQLSERVERMSSQLDATAmaster.mdf
-e
C:SQLMSSQL13.MSSQLSERVERMSSQLLogERRORLOG
-l
C:SQLMSSQL13.MSSQLSERVERMSSQLDATAmastlog.ldf
-T 2371
-T 4135
-T 2546
Параметры старта SQL server,
здесь видим флаги запуска службы SQL server, располжения системных баз данных.
2017-06-18
12:26:50.32 Server Command Line
Startup Parameters:
-s «MSSQLSERVER»
2017-06-18
12:26:52.86 Server SQL Server
detected 4 sockets with 24 cores per socket and 48 logical processors per
socket, 192 total logical processors; using 192 logical processors based on SQL
Server licensing. This is an informational message; no user action is required.
2017-06-18
12:26:52.86 Server SQL Server is
starting at normal priority base (=7). This is an informational message only.
No user action is required.
Видим, сколько процессоров на
сервере и включен ли HT.
2017-06-18
12:26:52.86 Server Detected 3193980
MB of RAM. This is an informational message; no user action is required.
Память на сервере, здесь 3 Тб.
2017-06-18
12:26:52.86 Server Using locked
pages in the memory manager.
2017-06-18
12:26:52.86 Server Large Page
Allocated: 32MB
2017-06-18
12:26:52.87 Server Large Page
Allocated: 32MB
2017-06-18
12:26:52.87 Server Large Page
Allocated: 32MB
2017-06-18
12:26:52.87 Server Large Page
Allocated: 32MB
Видим, что учетной записи SQL
server предоставлены права блокировать память на сервере, а также выделение
больших страниц в памяти.
2017-06-18
12:26:57.71 Server Machine supports
memory error recovery. SQL memory protection is enabled to recover from memory
corruption.
2017-06-18
12:27:00.82 Server Default
collation: Cyrillic_General_CI_AS (us_english 1033)
2017-06-18
12:27:00.82 Server Automatic
soft-NUMA was enabled because SQL Server has detected hardware NUMA nodes with
greater than 8 physical cores.
Включается soft-Numa в SQL 2016.
2017-06-18
12:27:00.90 Server Buffer pool
extension is already disabled. No action is necessary.
Buffer pool extension- выключен. Далее идет определения DAC, soft-numa, параметры блокировок:
2017-06-18
12:27:01.04 Server
InitializeExternalUserGroupSid failed. Implied authentication will be
disabled.
2017-06-18
12:27:01.04 Server Implied
authentication manager initialization failed. Implied authentication will be
disabled.
2017-06-18
12:27:01.13 Server The maximum
number of dedicated administrator connections for this instance is ‘1’
2017-06-18
12:27:01.13 Server This instance of
SQL Server last reported using a process ID of 8116 at 6/18/2017 1:06:37 PM
(local) 6/18/2017 10:06:37 AM (UTC). This is an informational message only; no
user action is required.
2017-06-18
12:27:01.13 Server Node
configuration: node 0: CPU mask: 0x0000000000555555:0 Active CPU mask:
0x0000000000555555:0. This message provides a description of the NUMA
configuration for this computer. This is an informational message only. No user
action is required.
…..
2017-06-18 12:27:01.14 Server Node configuration: node 15: CPU mask:
0x0000aaaaaa000000:3 Active CPU mask: 0x0000aaaaaa000000:3. This message
provides a description of the NUMA configuration for this computer. This is an
informational message only. No user action is required.
2017-06-18
12:27:01.31 Server Using dynamic
lock allocation. Initial allocation of
2500 Lock blocks and 5000 Lock Owner blocks per node. This is an informational message only. No user action is required.
2017-06-18
12:27:01.31 Server Lock partitioning
is enabled. This is an informational
message only. No user action is required.
2017-06-18
12:27:01.34 Server Database Instant
File Initialization: enabled. For security and performance considerations see
the topic ‘Database Instant File Initialization’ in SQL Server Books Online.
This is an informational message only. No user action is required.
2017-06-18
12:27:01.41 Server CLR version
v4.0.30319 loaded.
2017-06-18
12:27:01.51 Server Query Store
settings initialized with enabled = 1,
Включается компонент Query Store
Начинается старт системных бд:
2017-06-18
12:27:01.53 spid10s Starting up
database ‘master’.
2017-06-18
12:27:01.53 Server In-Memory OLTP
initialized on highend machine.
2017-06-18
12:27:01.59 Server Common language
runtime (CLR) functionality initialized using CLR version v4.0.30319 from
C:WindowsMicrosoft.NETFramework64v4.0.30319.
2017-06-18
12:27:01.72 spid10s CHECKDB for
database ‘master’ finished without errors on 2017-06-21 03:35:10.293 (local
time). This is an informational message only; no user action is required.
2017-06-18
12:27:01.72 spid10s Resource governor
reconfiguration succeeded.
2017-06-18
12:27:01.72 spid10s SQL Server Audit
is starting the audits. This is an informational message. No user action is
required.
2017-06-18
12:27:01.73 spid10s Audit: Server
Audit: 65537, Initialized and Assigned State: START_FAILED
2017-06-18
12:27:01.73 spid10s Audit: Server
Audit: 65537, Initialized and Assigned State: STARTED
2017-06-18
12:27:01.74 spid10s SQL Server Audit
has started the audits. This is an informational message. No user action is
required.
2017-06-18
12:27:01.78 spid10s Server name is
‘server1’. This is an informational message only. No user action is required.
Имя сервера, как не странно)
2017-06-18
12:27:01.80 spid10s Database
mirroring has been enabled on this instance of SQL Server.
2017-06-18
12:27:01.80 spid20s Always On: The
availability replica manager is starting. This is an informational message
only. No user action is required.
2017-06-18
12:27:01.81 spid20s Always On
Availability Groups: Waiting for local Windows Server Failover Clustering
service to start. This is an informational message only. No user action is
required.
2017-06-18
12:27:01.81 spid20s Always On
Availability Groups: Local Windows Server Failover Clustering service started.
This is an informational message only. No user action is required.
Сервер является частью кластера,
включен компонент AlwaysOn.
2017-06-18
12:27:01.81 spid12s Starting up
database ‘mssqlsystemresource’.
2017-06-18
12:27:01.81 spid20s Always On
Availability Groups: Waiting for local Windows Server Failover Clustering node
to start. This is an informational message only. No user action is required.
2017-06-18
12:27:01.81 spid20s Always On
Availability Groups: Local Windows Server Failover Clustering node started.
This is an informational message only. No user action is required.
2017-06-18
12:27:01.81 spid20s Always On
Availability Groups: Waiting for local Windows Server Failover Clustering node
to come online. This is an informational message only. No user action is
required.
2017-06-18
12:27:01.81 spid31s Starting up
database ‘DB’.
2017-06-18
12:27:01.81 spid22s Starting up
database ‘DB2’.
2017-06-18
12:27:01.81 spid25s Starting up
database ‘DB3’.
2017-06-18
12:27:01.81 spid26s Starting up
database ‘DB4’.
2017-06-18
12:27:01.82 spid24s Starting up
database ‘msdb’.
Получаем список баз данных на
сервере и далее можно отследить как они инициализируются, без проблем или нет.
2017-06-18
12:27:01.82 spid16s Server is
listening on [ ‘any’ <ipv6> 1433].
2017-06-18
12:27:01.82 spid16s Server is
listening on [ ‘any’ <ipv4> 1433].
Получили TCP порты на которые
настроен SQL Server
2017-06-18
12:27:01.82 spid16s Server local
connection provider is ready to accept connection on [
\.pipeSQLLocalMSSQLSERVER ].
2017-06-18
12:27:01.82 spid16s Server local
connection provider is ready to accept connection on [ \.pipesqlquery ].
2017-06-18
12:27:01.82 Server Server is
listening on [ ‘any’ <ipv6> 1434].
2017-06-18
12:27:01.82 Server Server is
listening on [ ‘any’ <ipv4> 1434].
2017-06-18
12:27:01.82 Server Dedicated admin connection support was
established for listening remotely on port 1434.
2017-06-18
12:27:01.83 spid31s [INFO]
HkHostDbCtxt::Initialize(): Database ID: [13] ‘DB’. XTP Engine version is 2.9
В базе данных используются
компоненты InMemory
2017-06-18
12:27:01.83 spid12s The resource
database build version is 13.00.4435. This is an informational message only. No
user action is required.
2017-06-18
12:27:01.83 spid16s SQL Server is now
ready for client connections. This is an informational message; no user action
is required.
2017-06-18
12:27:01.83 Server SQL Server is
attempting to register a Service Principal Name (SPN) for the SQL Server
service. Kerberos authentication will not be possible until a SPN is registered
for the SQL Server service. This is an informational message. No user action is
required.
Проблемы с SPN, возможные,
возможно SPN уже есть, просто нет прав на просмотр SPN.
2017-06-18
12:27:01.84 spid26s [INFO]
HkHostDbCtxt::Initialize(): Database ID: [8] ‘DB3’. XTP Engine version is 2.9.
2017-06-18
12:27:01.87 spid12s Starting up
database ‘model’.
2017-06-18
12:27:01.89 Server The SQL Server
Network Interface library could not register the Service Principal Name (SPN) [
MSSQLSvc/server1.ad.ru ] for the SQL Server service. Windows return code:
0x2098, state: 15. Failure to register a SPN might cause integrated
authentication to use NTLM instead of Kerberos. This is an informational
message. Further action is only required if Kerberos authentication is required
by authentication policies and if the SPN has not been manually registered.
2017-06-18
12:27:01.89 Server The SQL Server
Network Interface library could not register the Service Principal Name (SPN) [
MSSQLSvc/server1.ad.ru:1433 ] for the SQL Server service. Windows return code:
0x2098, state: 15. Failure to register a SPN might cause integrated
authentication to use NTLM instead of Kerberos. This is an informational
message. Further action is only required if Kerberos authentication is required
by authentication policies and if the SPN has not been manually registered.
2017-06-18
12:27:01.94 spid12s CHECKDB for
database ‘model’ finished without errors on 2017-06-21 03:38:53.560 (local
time). This is an informational message only; no user action is required.
2017-06-18
12:27:01.94 spid12s Polybase feature
disabled.
2017-06-18
12:27:01.94 spid12s Clearing tempdb
database.
2017-06-18
12:27:02.06 spid12s Starting up
database ‘tempdb’.
— стартовали системные бд, дальше
идут уже сообщения относящиеся к базам данных, работе сервера или ошибки.
Итак, мы прошлись по журналу ERRORLOG SQL Server, как видим, он
содержит много полезной информации и может служит начальной точкой при начале
диагностике проблем в MS SQL Server.
Если вас просят провести
диагностику сервера или решить проблемы, а с другой стороны специалист мало знаком
с SQL Server, просто попросите его
найти на сервере файл ERRORLOG,
заархивировать его и прислать вам, в итоге вы без лишних разговоров получите
много информации об сервере.
The SQL Server error log is a great source of information for DBAs for monitoring errors and the operation of the server. Greg Larsen explains the details and how to configure the SQL Server error log.
Most applications have a log of some sort that tracks activity. SQL Server is no different. It has a log file known as the error log for tracking what’s happening on an instance of SQL Server. Server. Each instance of SQL Server has its own set of error log files. In this article, I will discuss what the error log is, how SQL Server manages it, and where you can find it. I’ll also show you how to configure the SQL Server error log.
What is the error log?
The error log is a file that tracks what kind of activity is happening on an instance. The log is just a journal of events that have occurred on a SQL Server instance, in chronological order. The log doesn’t track everything, but it does track significant events and errors that occur while SQL Server is running. These errors could be informational only, warnings, as well as actual instance and application errors. You can find things like start up and shut down information, backup and restore commands, as well as custom application messages in the error log file. A DBA can also configure SQL Server to write additional logging, for example, logins and logouts. The error log is a great place to look for problems or potential problems associated with an instance of SQL Server.
The error log is not a single file but a series of files. Each time SQL Server starts up, a new error log file is created. A running instance of SQL Server writes to current log (the one created at startup) and by default has six archived error log files. If you need to keep more than six archived files, you can override the default to keep as many as you need (more on this later).
If an instance of SQL Server crashes or will not start for some reason, the error log is the place to go for troubleshooting these problems. As a DBA, you should periodically review the error log to look for potential problems. By reviewing the log, you might find some unusual things going on that might otherwise go unnoticed, like a backup job has failed or someone trying to hack the SA password.
Where can the error log files be found?
By default, the error log files are stored in the following location: Program FilesMicrosoft SQL ServerMSSQL<n>.<instance name>MSSQLLOGERRORLOG, where <n> is an archived version number, and <instance name> is the name of the instance. This is only the default location. Some instances might be set up to write their error log files to a different location. If the error log files are not in the default location, then there are a number of different ways to find them. I will show you two of those methods.
The first method is to use SQL Server Configuration Manager. To find the location of the log using this method, first, open up SQL Server Configuration Manager. Next double click on the instance of SQL Server that you want to locate the error log file location. Then click on the Advanced tab. The location of the error log file directory is identified in the Dump Directory item. To see the full name of the error log file directory, click on the little down error to the right of the Dump Directory item, as shown below in Figure 1.
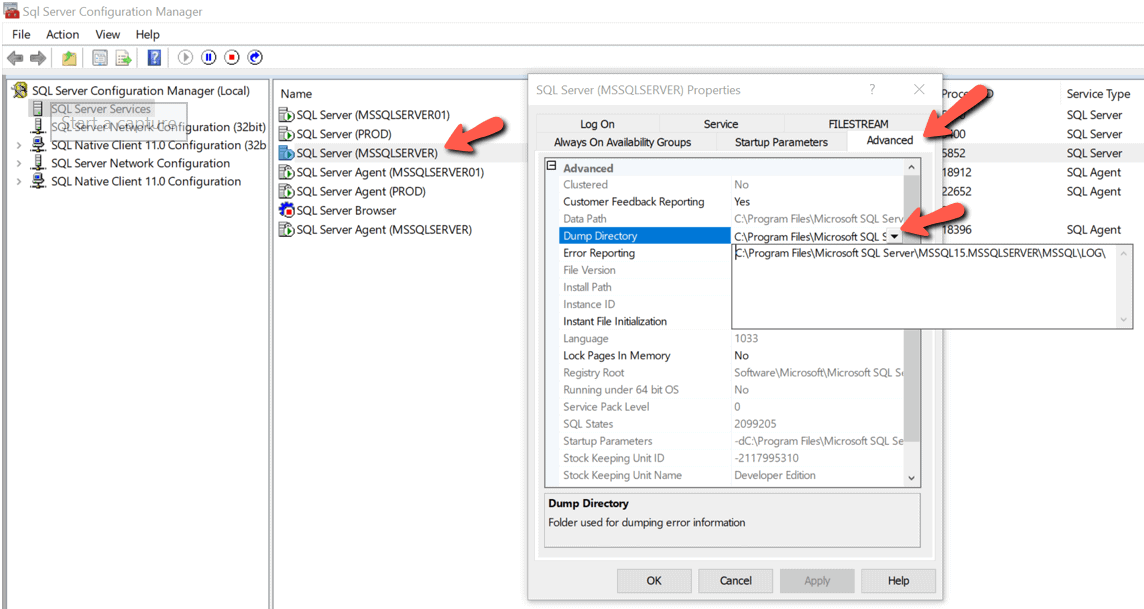
Figure 1: Location of error log file directory in Configuration Manager
A second method to find the location of the error log files is to use SSMS to browse one of the error log files. To do this, you must connect to the instance of SQL Server in which you want to find the error log location with SSMS. Expand the Management item and the SQL Server Logs item. Then double-click on the Current error log file. When you do this, the Log File Viewer will be displayed. To find the error log file location you can either browse thru the log file until you find it or use the Search… option to find it. When using the search option, use the string Logging SQL Server messages in file as the search criteria. The image in Figure 2 shows these steps. The log location can be found in the line that is highlighted in the log.
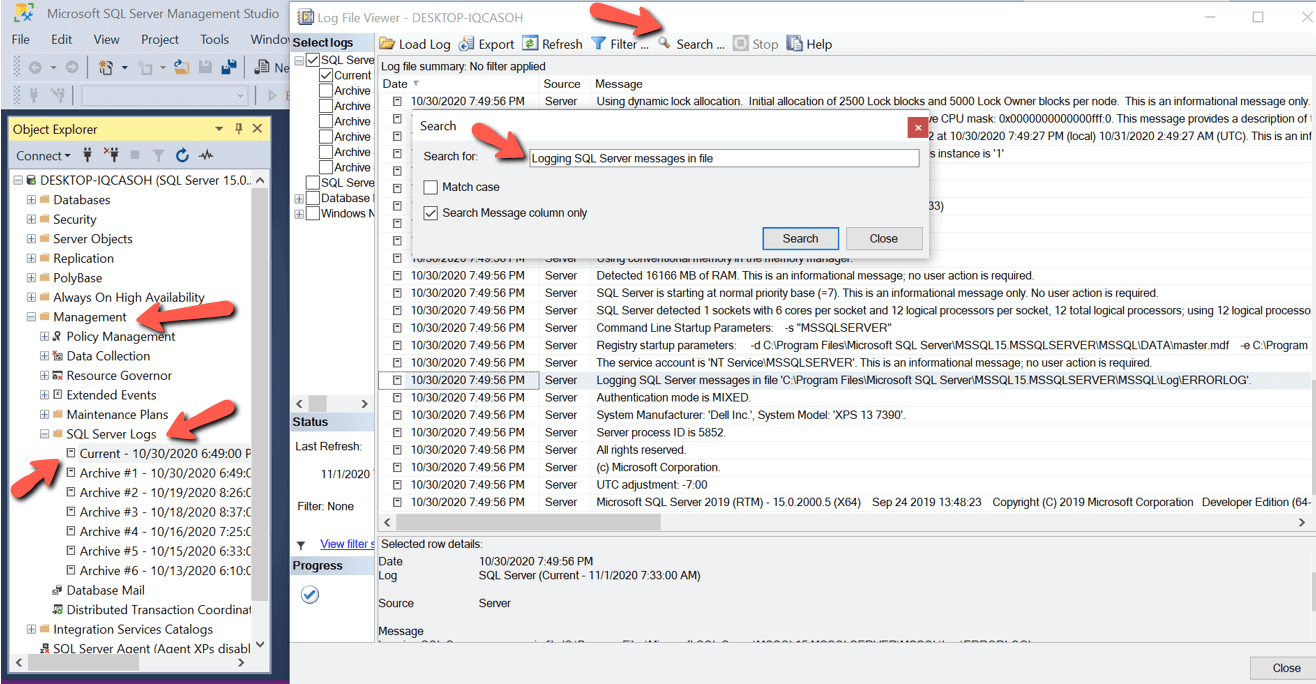
Figure 2: Using SSMS to find the location of error log files
Types of error log files and their naming conventions
Each SQL Server instance has two different types of error log files. There is an error log file for the currently running instance and then a number of archived error log files.
All error log files names start with ERRORLOG. The error log for the running instance is called just ERRORLOG, whereas all other error log files names start with ERRORLOG but have a number for the file extension. The archived error log files are ERRORLOG.1, ERRORLOG.2, ERROLOG.3, … up to the number to the configured number of archived error log files. Where ERRORLOG.1 is most recently archived error log file, ERRORLOG.2 is the second most recently archived error log file, ERRORLOG.3 is the third most recently archived error log file, etc. If an instance is configured with the default number of error log files, then the last archived error log file is named ERRORLOG.6.
When an instance is restarted, the oldest archived error log file (ERRORLOG.6 if the default number is used) is deleted, then each of the remaining error log files is renamed. ERRORLOG.5 is renamed to ERRORLOG.6, ERROLOG.4 is renamed to ERRORLOG.5, etc. until ERRORLOG.1 is renamed to ERRORLOG.2. The last current error log file (ERRORLOG) is renamed to ERRORLOG.1, and the error log file for the newly started instance is created with the name ERRORLOG.
Changing the number and size of the error log
By default, an instance of SQL Server retains six archived error log files, and the size of each log file is unlimited. An unlimited size means it will grow as big as it needs to be, or until it runs out of disk space. You may find that these default setting are fine, but they can also be overridden.
How many archived error log files do you need and what is an appropriate maximum size? Like most SQL Server questions, the answer is “it depends.” Here, I will demonstrate how the number and size of the error logs might help or hinder your use of the error log files and share my personal opinion of how many log files I like to have.
First, let me explore the number of archived log files. I like to retain at least two months’ worth of error log files. By having multiple months of error log information, I can track trends from one month to the next. Keep in mind that depending on what is logged and the activity of an instance, two months’ worth of error log files might take up a lot of disk space.
There is no easy way to keep exactly two months’ worth of error log files since a new error log is created and the oldest archived one is deleted every time an instance is restarted. The number of months of error log files depends on how often SQL Server is restarted and the number of archived error log files that are kept. Suppose an instance is recycled frequently over a short period of time due to some maintenance activity. Error log information will be cycled off based on the configured value for the number of archived error log files that should be retained.
There a few different methods to change the error log file configuration, I’ll mention two of them. The first method is to use SSMS. To use this method, first connect to the instance, expand the Management folder, right click on the SQL Server Log folder and then select the Configure item from the menu displayed, as shown in Figure 3.
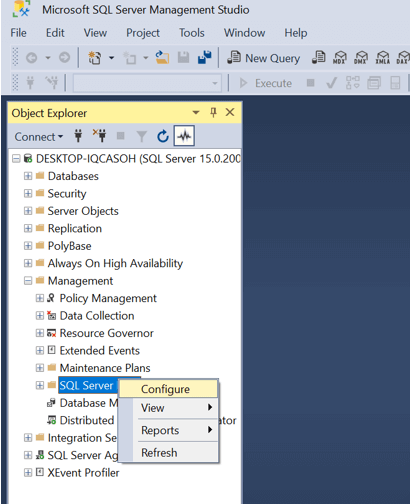
Figure 3: Bringing up the error log configuration screen
When clicking on Configure, the window shown in Figure 4 is displayed.
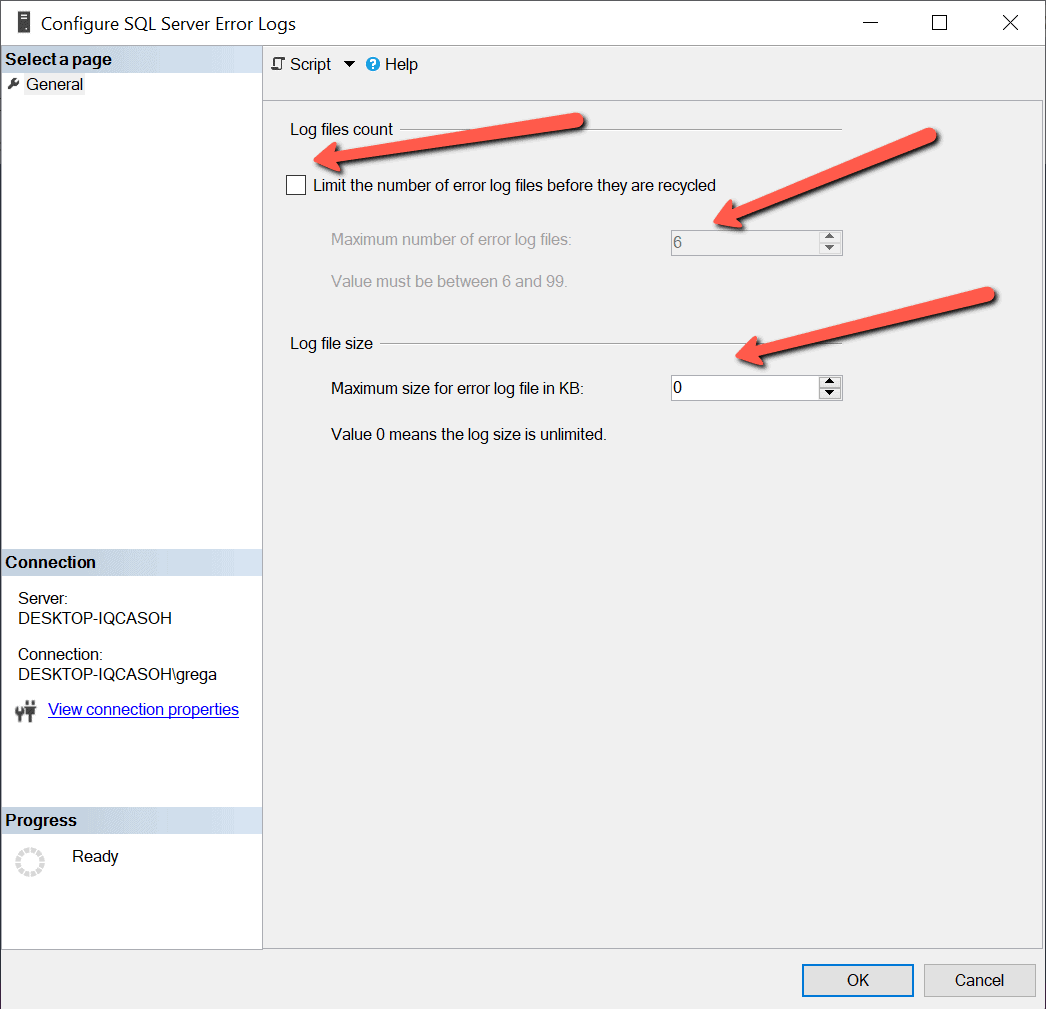
Figure 4; Configuration Options for the Error Log
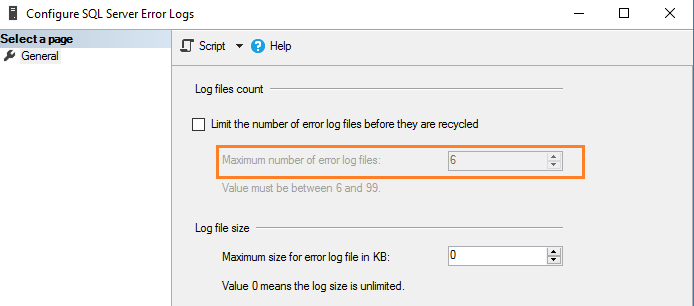
By reviewing Figure 4, you can see that my instance is currently configured to retain 6 archived error log files and the maximum size of the error log file is set to be 0, which means unlimited.
To change the number of archived error log files to retrain, first click on the checkbox labeled Limit the number of error log files before they are recycled. Doing this will enable the Maximum number of error log files option, so the number of error logs to retain can be changed. Note the number of error log files to retrain needs to be between 6 and 99.
To set a maximum limit of each error log file, enter the desired size into the Maximum size of the error log file in KB. When the error log configuration is set to limit the size of the error log file, a new error log file will be created automatically after the current log file reaches the maximum size. I personally don’t like to limit the size of the log file, but keep in mind, having an unlimited size setting means each log file will be different sizes, whereas limiting the size would make every error log file the same size.
Issues with multiple restarts
When SQL Server is restarted, the oldest archived error log file is deleted, and a new one is created. This cycling of the error log every time SQL Server restarts normally isn’t a problem, unless it deletes an archived error log file automatically that contains information that is needed for troubleshooting or trend reporting.
Since the log file contains messages and errors related to an instance, it is crucial not to lose this information until you no longer need it. The problem with having the default number of archived error log files is you might lose valuable troubleshooting information if an instance is restarted more than six times over a short period of time. This can happen for a number of different reasons. I have seen nighttime operations staff and DBAs restart an instance multiple times in an attempt to get an instance that has crashed back up and running. Suppose an instance of SQL Server is restarted multiple times without review of the error log files. The restarts might inadvertently cycle off the one critical error log file containing the error messages related to the crash. For this reason, it is important to configure SQL Server to retain enough archived error log files so they are not automatically deleted until they are no longer needed.
Keep in mind that cycling off a critical error log file is a rare situation. However, if an error log file that has valuable information about a crash is cycled off, it does hamper your troubleshooting options. Therefore, it is wise to have someone review the error log, or at least copy the error log file to a backup location after a crash to make sure you have all the log files to help with troubleshooting. At least by copying off the error log file after a crash, you can guarantee it will not be cycled off if lots of restarts are performed.
Cycling the ERRORLOG
A new error log is created every time SQL Server is restarted. Sometimes SQL Server stays up for weeks or even months before an instance is restarted. When an instance has been running for a long time, the error log will be quite large. It’s hard to review and find errors in large log files, especially when they contain error messages that could cover long periods of time.
To help keep the error log files from spanning months’ worth of messages without recycling, you can cycle the error log with a command. Cycling the error log will close the current log and create a new one. The code in Listing 1 uses the system stored procedure sp_cycle_errorlog to cycle the error log file.
Listing 1: Cycling the errorlog.
To execute the sp_cycle_errorlog system stored procedure, you need to be a member of the sysadmin fixed server role. Stored procedure sp_cycle_errorlog takes no parameters and returns a 0 if the error log is successfully recycled and a 1 if the cycling of the log has failed.
Error log file
The error log file contains messages and errors associated with a SQL Server instance. It is a valuable tool for troubleshooting problems with SQL Server as well as auditing what goes on within an instance of SQL Server. A DBA can configure SQL Server to store the error logs wherever they’d like and adjust the configuration to keep as many archived error log files as needed. As a DBA you should review this log every time SQL Server crashes and as part of your daily and weekly system checks. This review will ensure that SQL Server is functioning normally, with no unexpected errors showing up in the log.
Ingenious Guide to View Log File of SQL Server
Microsoft SQL Server application is one of the biggest waves in the relational database management system and handles huge database in a well-structured manner.
But, Digital Crimes Can Takes Place In SQL Server Too!!!!
Nowadays, Ex-employees or hackers intentionally modifies the values of databases in order to damage the organization assets. And it becomes difficult to analyze or examine who is the culprit manually. As a result, the Organizations run into big trouble.
Hold On!! There Is A Good News
In SQL Server, there is a transaction Log file that keep records of all transactions & modifications in database executed on a database in a Microsoft SQL Server. By reading the Log file, one can easily check who deleted data from table in SQL Server database. Plus, it is used by forensic investigator to examine SQL Server Transaction Log and view & check every log detail in a detailed manner. In short, with SQL Log file, it becomes easy to find out which query performed on which table at what time.
Here, we are going to answer how to view log file of SQL Server by using various workarounds. Just go through this article once and understand how to open or read transaction log file in Microsoft SQL Server 2017 / 2016 / 2014 / 2012 / 2008 / 2008 R2 / 2005.
Moreover, if user want to restore the deleted query from a log file, then they can go through this blog – How to Recover Data from Log file in SQL Server – A Complete Guide .
Methods Use For How to View Transaction Log File of SQL Server
In the following section, you will understand how to open, check and read transaction file to retrieve information about the data which had been altered. So, let’s get started!!
#Approach 1: Use Log File Viewer in SQL Server Management Studio
Basically, this method exclusively used to open and view the information about following logs in SSMS:
- Audit Collection
- Database Mail
- Job History
- Data Collection
- SQL Server
- SQL Server Agent
- Windows Events
Its prime function of Log File Viewer is to provide the report of activities taken place in SQL Server Management Studio. In fact, one can open the Log File Viewer wizard in different ways on the basis of information that you want to check. Now, go through the instructions to view log details in SQL Server.
How to View Log File of SQL Server Via. Log File Viewer
Step 1: Open Microsoft SQL Server Management Studio application. Here, we are using SQL Server 2014 environment for reading SQL Server Error Log.

Step 2: Connect to Server windows pops-up. Here, you need to select the Server Name and Type of Authentication. Afterward, click on Connect.

Step 3: In Object Explorer, go to Management as shown in the screenshot to examine or read log file of SQL Server 2014.

Step 4: Now, move to SQL Server Logs option.

Step 5: Now, Right-click on SQL Server Logs and select View >> SQL Server Log sequentially.

Step 6: All the Log summary displayed on Log File Viewer window. Here, you can select other logs such as SQL Server Agent , Database Mail from the left panel to check its information too.

#Approach 2: View Log File of SQL Server Via. Undocumented fn_dblog()
Originally, the function fn_dblog() is used to extract data from Transaction file of SQL Server for forensic purposes to analyze every log event performed on the table. So, let’s check out how to read transaction log file in Microsoft SQL Server 2017 / 2016 / 2014 / 2012 / 2008 / 2008 R2 / 2005 editions.
Steps to View Log File in SQL Server Using Fn_dblog()
Step 1: We have a table named as ‘Employee’. So, first view the values of the table using the following T-SQL.
Select * from employee.

Step 2: Afterward, alter the table data using update command. For this, execute the query;
Update employee set department ='IT' where emp_name = 'jeevan'

Step 3: Again, view the table values using the Select Query. Now, you can see a modified table.

Step 4: Run the fn_dblog function according to the need. Here, we execute the query to check out the time when update operation was executed.
Select [Begin Time], [Transaction Name] from fn_dblog(null , null) where [Transaction Name] = ‘Update’

Step 5: In a situation, when you want to analyze all the logs such as Delete etc. , then run the following T-SQL query.
Select [Begin Time], [Transaction Name] from fn_dblog(null, null)
However, there are some consequences attached with fn_dblog(). Actually, this function only provide the time of the query when it was committed instead of which data entry gets affected. Due to which, it becomes cumbersome to find out which table data get altered. This problem is overcome with the third technique where user can view the log file of SQL Server without any hassle. Apart from this, both the described technique can run in SQL Server Management Studio only. You cannot read a Transaction Log File in offline environment with Log File Viewer and Fn_dblog().
#Approach 3: Use Smart Solution to Analyze Transaction File Easily
To get exact information from SQL Log File, take the help of SysTools SQL Log Reader Software. With the help of this software, user can scan and analyze T-log file in human readable format. However, the tool works in Online as well as Offline environment. User can get the information like Transaction , Login Name , Time , Table Name , Query . It is a best software solution that answers the question – how to read SQL Server Transaction Log file.
Download Free SQL Log Analyzer
Related : How to Fix Log File Corruption – Step-By-Step Guide
In fact, after viewing the log file of SQL Server, user can export the query in Live SQL Server database environment , SQL Compatible Scripts , and in CSV format. Moreover , the software can read Transaction log file of every SQL Server edition.
That’s all about on how to View Log file of SQL Server. Now, go through the methods and opt the best that suitable for you and examine SQL Server Transaction Log file.
Frequently Asked Questions:-
How to open SQL Server database Transaction Log file (.ldf) in readable format?
Try SQL Log Analyzer tool to easily scan and read the Transaction .ldf file records.
How to view SQL Log file in SSMS?
Use Fn_dblog() function to read the details of transaction in SQL Server.
Can I read log file of SQL Server 2008?
With the help of SQL Log Viewer, one can read .ldf file and view Transaction, Transaction time, Table name and Query of Microsoft SQL Server 2017, 2016, 2014, 2012, 2008 and SQL Server 2005
Is it possible to examine SQL Transaction Log file?
Yes, with the help of mentioned workaround, one can easily examine SQL LDF file.