
The stats socket is not enabled by default. In order to enable it, it is
necessary to add one line in the global section of the haproxy configuration.
A second line is recommended to set a larger timeout, always appreciated when
issuing commands by hand :

    global
        stats socket /var/run/haproxy.sock mode 600 level admin
        stats timeout 2m

It is also possible to add multiple instances of the stats socket by repeating
the line, and make them listen to a TCP port instead of a UNIX socket. This is
never done by default because this is dangerous, but can be handy in some
situations :

    global
        stats socket /var/run/haproxy.sock mode 600 level admin
        stats socket ipv4@192.168.0.1:9999 level admin
        stats timeout 2m

To access the socket, an external utility such as "socat" is required. Socat is
a swiss-army knife to connect anything to anything. We use it to connect
terminals to the socket, or a couple of stdin/stdout pipes to it for scripts.
The two main syntaxes we'll use are the following :

    # socat /var/run/haproxy.sock stdio
    # socat /var/run/haproxy.sock readline

The first one is used with scripts. It is possible to send the output of a
script to haproxy, and pass haproxy's output to another script. That's useful
for retrieving counters or attack traces for example.

The second one is only useful for issuing commands by hand. It has the benefit
that the terminal is handled by the readline library which supports line
editing and history, which is very convenient when issuing repeated commands
(eg: watch a counter).

The socket supports two operation modes :
  - interactive
  - non-interactive

The non-interactive mode is the default when socat connects to the socket. In
this mode, a single line may be sent. It is processed as a whole, responses are
sent back, and the connection closes after the end of the response. This is the
mode that scripts and monitoring tools use. It is possible to send multiple
commands in this mode, they need to be delimited by a semi-colon (';'). For
example :

    # echo "show info;show stat;show table" | socat /var/run/haproxy stdio

If a command needs to use a semi-colon or a backslash (eg: in a value), it
must be preceded by a backslash ('').

The interactive mode displays a prompt ('>') and waits for commands to be
entered on the line, then processes them, and displays the prompt again to wait
for a new command. This mode is entered via the "prompt" command which must be
sent on the first line in non-interactive mode. The mode is a flip switch, if
"prompt" is sent in interactive mode, it is disabled and the connection closes
after processing the last command of the same line.

For this reason, when debugging by hand, it's quite common to start with the
"prompt" command :

   # socat /var/run/haproxy readline
   prompt
   > show info
   ...
   >

Since multiple commands may be issued at once, haproxy uses the empty line as a
delimiter to mark an end of output for each command, and takes care of ensuring
that no command can emit an empty line on output. A script can thus easily
parse the output even when multiple commands were pipelined on a single line.

Some commands may take an optional payload. To add one to a command, the first
line needs to end with the "<<n" pattern. The next lines will be treated as
the payload and can contain as many lines as needed. To validate a command with
a payload, it needs to end with an empty line.

Limitations do exist: the length of the whole buffer passed to the CLI must
not be greater than tune.bfsize and the pattern "<<" must not be glued to the
last word of the line.

When entering a paylod while in interactive mode, the prompt will change from
"> " to "+ ".

It is important to understand that when multiple haproxy processes are started
on the same sockets, any process may pick up the request and will output its
own stats.

The list of commands currently supported on the stats socket is provided below.
If an unknown command is sent, haproxy displays the usage message which reminds
all supported commands. Some commands support a more complex syntax, generally
it will explain what part of the command is invalid when this happens.

Some commands require a higher level of privilege to work. If you do not have
enough privilege, you will get an error "Permission denied". Please check
the "level" option of the "bind" keyword lines in the configuration manual
for more information.
abort ssl ca-file <cafile>
Abort and destroy a temporary CA file update transaction.

See also "set ssl ca-file" and "commit ssl ca-file".
abort ssl cert <filename>
Abort and destroy a temporary SSL certificate update transaction.

See also "set ssl cert" and "commit ssl cert".
abort ssl crl-file <crlfile>
Abort and destroy a temporary CRL file update transaction.

See also "set ssl crl-file" and "commit ssl crl-file".
add acl [@<ver>] <acl> <pattern>
Add an entry into the acl <acl>. <acl> is the #<id> or the <file> returned by
"show acl". This command does not verify if the entry already exists. Entries
are added to the current version of the ACL, unless a specific version is
specified with "@<ver>". This version number must have preliminary been
allocated by "prepare acl", and it will be comprised between the versions
reported in "curr_ver" and "next_ver" on the output of "show acl". Entries
added with a specific version number will not match until a "commit acl"
operation is performed on them. They may however be consulted using the
"show acl @<ver>" command, and cleared using a "clear acl @<ver>" command.
This command cannot be used if the reference <acl> is a file also used with
a map. In this case, the "add map" command must be used instead.
add map [@<ver>] <map> <key> <value>
add map [@<ver>] <map> <payload>
Add an entry into the map <map> to associate the value <value> to the key
<key>. This command does not verify if the entry already exists. It is
mainly used to fill a map after a "clear" or "prepare" operation. Entries
are added to the current version of the ACL, unless a specific version is
specified with "@<ver>". This version number must have preliminary been
allocated by "prepare acl", and it will be comprised between the versions
reported in "curr_ver" and "next_ver" on the output of "show acl". Entries
added with a specific version number will not match until a "commit map"
operation is performed on them. They may however be consulted using the
"show map @<ver>" command, and cleared using a "clear acl @<ver>" command.
If the designated map is also used as an ACL, the ACL will only match the
<key> part and will ignore the <value> part. Using the payload syntax it is
possible to add multiple key/value pairs by entering them on separate lines.
On each new line, the first word is the key and the rest of the line is
considered to be the value which can even contains spaces.
Example:
# socat /tmp/sock1 -
prompt

> add map #-1 <<
+ key1 value1
+ key2 value2 with spaces
+ key3 value3 also with spaces
+ key4 value4

>
add server <backend>/<server> [args]*
Instantiate a new server attached to the backend <backend>.

The <server> name must not be already used in the backend. A special
restriction is put on the backend which must used a dynamic load-balancing
algorithm. A subset of keywords from the server config file statement can be
used to configure the server behavior. Also note that no settings will be
reused from an hypothetical 'default-server' statement in the same backend.

Currently a dynamic server is statically initialized with the "none"
init-addr method. This means that no resolution will be undertaken if a FQDN
is specified as an address, even if the server creation will be validated.

To support the reload operations, it is expected that the server created via
the CLI is also manually inserted in the relevant haproxy configuration file.
A dynamic server not present in the configuration won't be restored after a
reload operation.

A dynamic server may use the "track" keyword to follow the check status of
another server from the configuration. However, it is not possible to track
another dynamic server. This is to ensure that the tracking chain is kept
consistent even in the case of dynamic servers deletion.

Use the "check" keyword to enable health-check support. Note that the
health-check is disabled by default and must be enabled independently from
the server using the "enable health" command. For agent checks, use the
"agent-check" keyword and the "enable agent" command. Note that in this case
the server may be activated via the agent depending on the status reported,
without an explicit "enable server" command. This also means that extra care
is required when removing a dynamic server with agent check. The agent should
be first deactivated via "disable agent" to be able to put the server in the
required maintenance mode before removal.

It may be possible to reach the fd limit when using a large number of dynamic
servers. Please refer to the "u-limit" global keyword documentation in this
case.

Here is the list of the currently supported keywords :

- agent-addr
- agent-check
- agent-inter
- agent-port
- agent-send
- allow-0rtt
- alpn
- addr
- backup
- ca-file
- check
- check-alpn
- check-proto
- check-send-proxy
- check-sni
- check-ssl
- check-via-socks4
- ciphers
- ciphersuites
- crl-file
- crt
- disabled
- downinter
- enabled
- error-limit
- fall
- fastinter
- force-sslv3/tlsv10/tlsv11/tlsv12/tlsv13
- id
- inter
- maxconn
- maxqueue
- minconn
- no-ssl-reuse
- no-sslv3/tlsv10/tlsv11/tlsv12/tlsv13
- no-tls-tickets
- npn
- observe
- on-error
- on-marked-down
- on-marked-up
- pool-low-conn
- pool-max-conn
- pool-purge-delay
- port
- proto
- proxy-v2-options
- rise
- send-proxy
- send-proxy-v2
- send-proxy-v2-ssl
- send-proxy-v2-ssl-cn
- slowstart
- sni
- source
- ssl
- ssl-max-ver
- ssl-min-ver
- tfo
- tls-tickets
- track
- usesrc
- verify
- verifyhost
- weight
- ws

Their syntax is similar to the server line from the configuration file,
please refer to their individual documentation for details.
add ssl ca-file <cafile> <payload>
Add a new certificate to a ca-file. This command is useful when you reached
the buffer size limit on the CLI and want to add multiple certicates.
Instead of doing a «set» with all the certificates you are able to add each
certificate individually. A «set ssl ca-file» will reset the ca-file.
Example:
echo -e "set ssl ca-file cafile.pem <<n$(cat rootCA.crt)n" |
socat /var/run/haproxy.stat -
echo -e "add ssl ca-file cafile.pem <<n$(cat intermediate1.crt)n" |
socat /var/run/haproxy.stat -
echo -e "add ssl ca-file cafile.pem <<n$(cat intermediate2.crt)n" |
socat /var/run/haproxy.stat -
echo "commit ssl ca-file cafile.pem" | socat /var/run/haproxy.stat -
add ssl crt-list <crtlist> <certificate>
add ssl crt-list <crtlist> <payload>
Add an certificate in a crt-list. It can also be used for directories since
directories are now loaded the same way as the crt-lists. This command allow
you to use a certificate name in parameter, to use SSL options or filters a
crt-list line must sent as a payload instead. Only one crt-list line is
supported in the payload. This command will load the certificate for every
bind lines using the crt-list. To push a new certificate to HAProxy the
commands "new ssl cert" and "set ssl cert" must be used.
Example:
$ echo "new ssl cert foobar.pem" | socat /tmp/sock1 -
$ echo -e "set ssl cert foobar.pem <<n$(cat foobar.pem)n" | socat
/tmp/sock1 -
$ echo "commit ssl cert foobar.pem" | socat /tmp/sock1 -
$ echo "add ssl crt-list certlist1 foobar.pem" | socat /tmp/sock1 -

$ echo -e 'add ssl crt-list certlist1 <<nfoobar.pem [allow-0rtt] foo.bar.com
!test1.comn' | socat /tmp/sock1 -
Clear the max values of the statistics counters in each proxy (frontend &
backend) and in each server. The accumulated counters are not affected. The
internal activity counters reported by "show activity" are also reset. This
can be used to get clean counters after an incident, without having to
restart nor to clear traffic counters. This command is restricted and can
only be issued on sockets configured for levels "operator" or "admin".
Clear all statistics counters in each proxy (frontend & backend) and in each
server. This has the same effect as restarting. This command is restricted
and can only be issued on sockets configured for level "admin".
clear acl [@<ver>] <acl>
Remove all entries from the acl <acl>. <acl> is the #<id> or the <file>
returned by "show acl". Note that if the reference <acl> is a file and is
shared with a map, this map will be also cleared. By default only the current
version of the ACL is cleared (the one being matched against). However it is
possible to specify another version using '@' followed by this version.
clear map [@<ver>] <map>
Remove all entries from the map <map>. <map> is the #<id> or the <file>
returned by "show map". Note that if the reference <map> is a file and is
shared with a acl, this acl will be also cleared. By default only the current
version of the map is cleared (the one being matched against). However it is
possible to specify another version using '@' followed by this version.
clear table <table> [ data.<type> <operator> <value> ] | [ key <key> ]
Remove entries from the stick-table <table>.

This is typically used to unblock some users complaining they have been
abusively denied access to a service, but this can also be used to clear some
stickiness entries matching a server that is going to be replaced (see "show
table" below for details).  Note that sometimes, removal of an entry will be
refused because it is currently tracked by a session. Retrying a few seconds
later after the session ends is usual enough.

In the case where no options arguments are given all entries will be removed.

When the "data." form is used entries matching a filter applied using the
stored data (see "stick-table" in section 4.2) are removed.  A stored data
type must be specified in <type>, and this data type must be stored in the
table otherwise an error is reported. The data is compared according to
<operator> with the 64-bit integer <value>.  Operators are the same as with
the ACLs :

  - eq : match entries whose data is equal to this value
  - ne : match entries whose data is not equal to this value
  - le : match entries whose data is less than or equal to this value
  - ge : match entries whose data is greater than or equal to this value
  - lt : match entries whose data is less than this value
  - gt : match entries whose data is greater than this value

When the key form is used the entry <key> is removed.  The key must be of the
same type as the table, which currently is limited to IPv4, IPv6, integer and
string.
Example :
    $ echo "show table http_proxy" | socat stdio /tmp/sock1
>>> # table: http_proxy, type: ip, size:204800, used:2
>>> 0x80e6a4c: key=127.0.0.1 use=0 exp=3594729 gpc0=0 conn_rate(30000)=1
      bytes_out_rate(60000)=187
>>> 0x80e6a80: key=127.0.0.2 use=0 exp=3594740 gpc0=1 conn_rate(30000)=10
      bytes_out_rate(60000)=191

    $ echo "clear table http_proxy key 127.0.0.1" | socat stdio /tmp/sock1

    $ echo "show table http_proxy" | socat stdio /tmp/sock1
>>> # table: http_proxy, type: ip, size:204800, used:1
>>> 0x80e6a80: key=127.0.0.2 use=0 exp=3594740 gpc0=1 conn_rate(30000)=10
      bytes_out_rate(60000)=191
    $ echo "clear table http_proxy data.gpc0 eq 1" | socat stdio /tmp/sock1
    $ echo "show table http_proxy" | socat stdio /tmp/sock1
>>> # table: http_proxy, type: ip, size:204800, used:1
commit acl @<ver> <acl>
  Commit all changes made to version <ver> of ACL <acl>, and deletes all past
  versions. <acl> is the #<id> or the <file> returned by "show acl". The
  version number must be between "curr_ver"+1 and "next_ver" as reported in
  "show acl". The contents to be committed to the ACL can be consulted with
  "show acl @<ver> <acl>" if desired. The specified version number has normally
  been created with the "prepare acl" command. The replacement is atomic. It
  consists in atomically updating the current version to the specified version,
  which will instantly cause all entries in other versions to become invisible,
  and all entries in the new version to become visible. It is also possible to
  use this command to perform an atomic removal of all visible entries of an
  ACL by calling "prepare acl" first then committing without adding any
  entries. This command cannot be used if the reference <acl> is a file also
  used as a map. In this case, the "commit map" command must be used instead.

commit map @<ver> <map>
  Commit all changes made to version <ver> of map <map>, and deletes all past
  versions. <map> is the #<id> or the <file> returned by "show map". The
  version number must be between "curr_ver"+1 and "next_ver" as reported in
  "show map". The contents to be committed to the map can be consulted with
  "show map @<ver> <map>" if desired. The specified version number has normally
  been created with the "prepare map" command. The replacement is atomic. It
  consists in atomically updating the current version to the specified version,
  which will instantly cause all entries in other versions to become invisible,
  and all entries in the new version to become visible. It is also possible to
  use this command to perform an atomic removal of all visible entries of an
  map by calling "prepare map" first then committing without adding any
  entries.
commit ssl ca-file <cafile>
Commit a temporary SSL CA file update transaction.

In the case of an existing CA file (in a "Used" state in "show ssl ca-file"),
the new CA file tree entry is inserted in the CA file tree and every instance
that used the CA file entry is rebuilt, along with the SSL contexts it needs.
All the contexts previously used by the rebuilt instances are removed.
Upon success, the previous CA file entry is removed from the tree.
Upon failure, nothing is removed or deleted, and all the original SSL
contexts are kept and used.
Once the temporary transaction is committed, it is destroyed.

In the case of a new CA file (after a "new ssl ca-file" and in a "Unused"
state in "show ssl ca-file"), the CA file will be inserted in the CA file
tree but it won't be used anywhere in HAProxy. To use it and generate SSL
contexts that use it, you will need to add it to a crt-list with "add ssl
crt-list".

See also "new ssl ca-file", "set ssl ca-file", "add ssl ca-file",
"abort ssl ca-file" and "add ssl crt-list".
commit ssl cert <filename>
Commit a temporary SSL certificate update transaction.

In the case of an existing certificate (in a "Used" state in "show ssl
cert"), generate every SSL contextes and SNIs it need, insert them, and
remove the previous ones. Replace in memory the previous SSL certificates
everywhere the <filename> was used in the configuration. Upon failure it
doesn't remove or insert anything. Once the temporary transaction is
committed, it is destroyed.

In the case of a new certificate (after a "new ssl cert" and in a "Unused"
state in "show ssl cert"), the certificate will be committed in a certificate
storage, but it won't be used anywhere in haproxy. To use it and generate
its SNIs you will need to add it to a crt-list or a directory with "add ssl
crt-list".

See also "new ssl cert", "set ssl cert", "abort ssl cert" and
"add ssl crt-list".
commit ssl crl-file <crlfile>
Commit a temporary SSL CRL file update transaction.

In the case of an existing CRL file (in a "Used" state in "show ssl
crl-file"), the new CRL file entry is inserted in the CA file tree (which
holds both the CA files and the CRL files) and every instance that used the
CRL file entry is rebuilt, along with the SSL contexts it needs.
All the contexts previously used by the rebuilt instances are removed.
Upon success, the previous CRL file entry is removed from the tree.
Upon failure, nothing is removed or deleted, and all the original SSL
contexts are kept and used.
Once the temporary transaction is committed, it is destroyed.

In the case of a new CRL file (after a "new ssl crl-file" and in a "Unused"
state in "show ssl crl-file"), the CRL file will be inserted in the CRL file
tree but it won't be used anywhere in HAProxy. To use it and generate SSL
contexts that use it, you will need to add it to a crt-list with "add ssl
crt-list".

See also "new ssl crl-file", "set ssl crl-file", "abort ssl crl-file" and
"add ssl crt-list".
debug dev <command> [args]*
Call a developer-specific command. Only supported on a CLI connection running
in expert mode (see "expert-mode on"). Such commands are extremely dangerous
and not forgiving, any misuse may result in a crash of the process. They are
intended for experts only, and must really not be used unless told to do so.
Some of them are only available when haproxy is built with DEBUG_DEV defined
because they may have security implications. All of these commands require
admin privileges, and are purposely not documented to avoid encouraging their
use by people who are not at ease with the source code.
del acl <acl> [<key>|#<ref>]
Delete all the acl entries from the acl <acl> corresponding to the key <key>.
<acl> is the #<id> or the <file> returned by "show acl". If the <ref> is used,
this command delete only the listed reference. The reference can be found with
listing the content of the acl. Note that if the reference <acl> is a file and
is shared with a map, the entry will be also deleted in the map.
del map <map> [<key>|#<ref>]
Delete all the map entries from the map <map> corresponding to the key <key>.
<map> is the #<id> or the <file> returned by "show map". If the <ref> is used,
this command delete only the listed reference. The reference can be found with
listing the content of the map. Note that if the reference <map> is a file and
is shared with a acl, the entry will be also deleted in the map.
del ssl ca-file <cafile>
Delete a CA file tree entry from HAProxy. The CA file must be unused and
removed from any crt-list. "show ssl ca-file" displays the status of the CA
files. The deletion doesn't work with a certificate referenced directly with
the "ca-file" or "ca-verify-file" directives in the configuration.
del ssl cert <certfile>
Delete a certificate store from HAProxy. The certificate must be unused and
removed from any crt-list or directory. "show ssl cert" displays the status
of the certificate. The deletion doesn't work with a certificate referenced
directly with the "crt" directive in the configuration.
del ssl crl-file <crlfile>
Delete a CRL file tree entry from HAProxy. The CRL file must be unused and
removed from any crt-list. "show ssl crl-file" displays the status of the CRL
files. The deletion doesn't work with a certificate referenced directly with
the "crl-file" directive in the configuration.
del ssl crt-list <filename> <certfile[:line]>
Delete an entry in a crt-list. This will delete every SNIs used for this
entry in the frontends. If a certificate is used several time in a crt-list,
you will need to provide which line you want to delete. To display the line
numbers, use "show ssl crt-list -n <crtlist>".
del server <backend>/<server>
Remove a server attached to the backend <backend>. All servers are eligible,
except servers which are referenced by other configuration elements. The
server must be put in maintenance mode prior to its deletion.  The operation
is cancelled if the serveur still has active or idle connection or its
connection queue is not empty.
disable agent <backend>/<server>
Mark the auxiliary agent check as temporarily stopped.

In the case where an agent check is being run as a auxiliary check, due
to the agent-check parameter of a server directive, new checks are only
initialized when the agent is in the enabled. Thus, disable agent will
prevent any new agent checks from begin initiated until the agent
re-enabled using enable agent.

When an agent is disabled the processing of an auxiliary agent check that
was initiated while the agent was set as enabled is as follows: All
results that would alter the weight, specifically "drain" or a weight
returned by the agent, are ignored. The processing of agent check is
otherwise unchanged.

The motivation for this feature is to allow the weight changing effects
of the agent checks to be paused to allow the weight of a server to be
configured using set weight without being overridden by the agent.

This command is restricted and can only be issued on sockets configured for
level "admin".
disable dynamic-cookie backend <backend>
Disable the generation of dynamic cookies for the backend <backend>
disable frontend <frontend>
Mark the frontend as temporarily stopped. This corresponds to the mode which
is used during a soft restart : the frontend releases the port but can be
enabled again if needed. This should be used with care as some non-Linux OSes
are unable to enable it back. This is intended to be used in environments
where stopping a proxy is not even imaginable but a misconfigured proxy must
be fixed. That way it's possible to release the port and bind it into another
process to restore operations. The frontend will appear with status "STOP"
on the stats page.

The frontend may be specified either by its name or by its numeric ID,
prefixed with a sharp ('#').

This command is restricted and can only be issued on sockets configured for
level "admin".
disable health <backend>/<server>
Mark the primary health check as temporarily stopped. This will disable
sending of health checks, and the last health check result will be ignored.
The server will be in unchecked state and considered UP unless an auxiliary
agent check forces it down.

This command is restricted and can only be issued on sockets configured for
level "admin".
disable server <backend>/<server>
Mark the server DOWN for maintenance. In this mode, no more checks will be
performed on the server until it leaves maintenance.
If the server is tracked by other servers, those servers will be set to DOWN
during the maintenance.

In the statistics page, a server DOWN for maintenance will appear with a
"MAINT" status, its tracking servers with the "MAINT(via)" one.

Both the backend and the server may be specified either by their name or by
their numeric ID, prefixed with a sharp ('#').

This command is restricted and can only be issued on sockets configured for
level "admin".
enable agent <backend>/<server>
Resume auxiliary agent check that was temporarily stopped.

See "disable agent" for details of the effect of temporarily starting
and stopping an auxiliary agent.

This command is restricted and can only be issued on sockets configured for
level "admin".
enable dynamic-cookie backend <backend>
Enable the generation of dynamic cookies for the backend <backend>.
A secret key must also be provided.
enable frontend <frontend>
Resume a frontend which was temporarily stopped. It is possible that some of
the listening ports won't be able to bind anymore (eg: if another process
took them since the 'disable frontend' operation). If this happens, an error
is displayed. Some operating systems might not be able to resume a frontend
which was disabled.

The frontend may be specified either by its name or by its numeric ID,
prefixed with a sharp ('#').

This command is restricted and can only be issued on sockets configured for
level "admin".
enable health <backend>/<server>
Resume a primary health check that was temporarily stopped. This will enable
sending of health checks again. Please see "disable health" for details.

This command is restricted and can only be issued on sockets configured for
level "admin".
enable server <backend>/<server>
If the server was previously marked as DOWN for maintenance, this marks the
server UP and checks are re-enabled.

Both the backend and the server may be specified either by their name or by
their numeric ID, prefixed with a sharp ('#').

This command is restricted and can only be issued on sockets configured for
level "admin".
experimental-mode [on|off]
Without options, this indicates whether the experimental mode is enabled or
disabled on the current connection. When passed "on", it turns the
experimental mode on for the current CLI connection only. With "off" it turns
it off.

The experimental mode is used to access to extra features still in
development. These features are currently not stable and should be used with
care. They may be subject to breaking changes across versions.

When used from the master CLI, this command shouldn't be prefixed, as it will
set the mode for any worker when connecting to its CLI.
Example:
echo "@1; experimental-mode on; <experimental_cmd>..." | socat /var/run/haproxy.master -
echo "experimental-mode on; @1 <experimental_cmd>..." | socat /var/run/haproxy.master -
expert-mode [on|off]
This command is similar to experimental-mode but is used to toggle the
expert mode.

The expert mode enables displaying of expert commands that can be extremely
dangerous for the process and which may occasionally help developers collect
important information about complex bugs. Any misuse of these features will
likely lead to a process crash. Do not use this option without being invited
to do so. Note that this command is purposely not listed in the help message.
This command is only accessible in admin level. Changing to another level
automatically resets the expert mode.

When used from the master CLI, this command shouldn't be prefixed, as it will
set the mode for any worker when connecting to its CLI.
Example:
echo "@1; expert-mode on; debug dev exit 1" | socat /var/run/haproxy.master -
echo "expert-mode on; @1 debug dev exit 1" | socat /var/run/haproxy.master -
get map <map> <value>
get acl <acl> <value>
Lookup the value <value> in the map <map> or in the ACL <acl>. <map> or <acl>
are the #<id> or the <file> returned by "show map" or "show acl". This command
returns all the matching patterns associated with this map. This is useful for
debugging maps and ACLs. The output format is composed by one line par
matching type. Each line is composed by space-delimited series of words.

The first two words are:

   <match method>:   The match method applied. It can be "found", "bool",
                     "int", "ip", "bin", "len", "str", "beg", "sub", "dir",
                     "dom", "end" or "reg".

   <match result>:   The result. Can be "match" or "no-match".

The following words are returned only if the pattern matches an entry.

   <index type>:     "tree" or "list". The internal lookup algorithm.

   <case>:           "case-insensitive" or "case-sensitive". The
                     interpretation of the case.

   <entry matched>:  match="<entry>". Return the matched pattern. It is
                     useful with regular expressions.

The two last word are used to show the returned value and its type. With the
"acl" case, the pattern doesn't exist.

   return=nothing:        No return because there are no "map".
   return="<value>":      The value returned in the string format.
   return=cannot-display: The value cannot be converted as string.

   type="<type>":         The type of the returned sample.
get var <name>
Show the existence, type and contents of the process-wide variable 'name'.
Only process-wide variables are readable, so the name must begin with
'proc.' otherwise no variable will be found. This command requires levels
"operator" or "admin".
get weight <backend>/<server>
Report the current weight and the initial weight of server <server> in
backend <backend> or an error if either doesn't exist. The initial weight is
the one that appears in the configuration file. Both are normally equal
unless the current weight has been changed. Both the backend and the server
may be specified either by their name or by their numeric ID, prefixed with a
sharp ('#').
help [<command>]
Print the list of known keywords and their basic usage, or commands matching
the requested one. The same help screen is also displayed for unknown
commands.
httpclient <method> <URI>
Launch an HTTP client request and print the response on the CLI. Only
supported on a CLI connection running in expert mode (see "expert-mode on").
It's only meant for debugging. The httpclient is able to resolve a server
name in the URL using the "default" resolvers section, which is populated
with the DNS servers of your /etc/resolv.conf by default. However it won't be
able to resolve an host from /etc/hosts if you don't use a local dns daemon
which can resolve those.
new ssl ca-file <cafile>
Create a new empty CA file tree entry to be filled with a set of CA
certificates and added to a crt-list. This command should be used in
combination with "set ssl ca-file", "add ssl ca-file" and "add ssl crt-list".
new ssl cert <filename>
Create a new empty SSL certificate store to be filled with a certificate and
added to a directory or a crt-list. This command should be used in
combination with "set ssl cert" and "add ssl crt-list".
new ssl crl-file <crlfile>
Create a new empty CRL file tree entry to be filled with a set of CRLs
and added to a crt-list. This command should be used in combination with "set
ssl crl-file" and "add ssl crt-list".
prepare acl <acl>
Allocate a new version number in ACL <acl> for atomic replacement. <acl> is
the #<id> or the <file> returned by "show acl". The new version number is
shown in response after "New version created:". This number will then be
usable to prepare additions of new entries into the ACL which will then
atomically replace the current ones once committed. It is reported as
"next_ver" in "show acl". There is no impact of allocating new versions, as
unused versions will automatically be removed once a more recent version is
committed. Version numbers are unsigned 32-bit values which wrap at the end,
so care must be taken when comparing them in an external program. This
command cannot be used if the reference <acl> is a file also used as a map.
In this case, the "prepare map" command must be used instead.
prepare map <map>
Allocate a new version number in map <map> for atomic replacement. <map> is
the #<id> or the <file> returned by "show map". The new version number is
shown in response after "New version created:". This number will then be
usable to prepare additions of new entries into the map which will then
atomically replace the current ones once committed. It is reported as
"next_ver" in "show map". There is no impact of allocating new versions, as
unused versions will automatically be removed once a more recent version is
committed. Version numbers are unsigned 32-bit values which wrap at the end,
so care must be taken when comparing them in an external program.
Toggle the prompt at the beginning of the line and enter or leave interactive
mode. In interactive mode, the connection is not closed after a command
completes. Instead, the prompt will appear again, indicating the user that
the interpreter is waiting for a new command. The prompt consists in a right
angle bracket followed by a space "> ". This mode is particularly convenient
when one wants to periodically check information such as stats or errors.
It is also a good idea to enter interactive mode before issuing a "help"
command.
Close the connection when in interactive mode.
set anon [on|off] [<key>]
This command enables or disables the "anonymized mode" for the current CLI
session, which replaces certain fields considered sensitive or confidential
in command outputs with hashes that preserve sufficient consistency between
elements to help developers identify relations between elements when trying
to spot bugs, but a low enough bit count (24) to make them non-reversible due
to the high number of possible matches. When turned on, if no key is
specified, the global key will be used (either specified in the configuration
file by "anonkey" or set via the CLI command "set anon global-key"). If no such
key was set, a random one will be generated. Otherwise it's possible to
specify the 32-bit key to be used for the current session, for example, to
reuse the key that was used in a previous dump to help compare outputs.
Developers will never need this key and it's recommended never to share it as
it could allow to confirm/infirm some guesses about what certain hashes could
be hiding.
set dynamic-cookie-key backend <backend> <value>
Modify the secret key used to generate the dynamic persistent cookies.
This will break the existing sessions.
set anon global-key <key>
This sets the global anonymizing key to <key>, which must be a 32-bit
integer between 0 and 4294967295 (0 disables the global key). This command
requires admin privilege.
set map <map> [<key>|#<ref>] <value>
Modify the value corresponding to each key <key> in a map <map>. <map> is the
#<id> or <file> returned by "show map". If the <ref> is used in place of
<key>, only the entry pointed by <ref> is changed. The new value is <value>.
set maxconn frontend <frontend> <value>
Dynamically change the specified frontend's maxconn setting. Any positive
value is allowed including zero, but setting values larger than the global
maxconn does not make much sense. If the limit is increased and connections
were pending, they will immediately be accepted. If it is lowered to a value
below the current number of connections, new connections acceptation will be
delayed until the threshold is reached. The frontend might be specified by
either its name or its numeric ID prefixed with a sharp ('#').
set maxconn server <backend/server> <value>
Dynamically change the specified server's maxconn setting. Any positive
value is allowed including zero, but setting values larger than the global
maxconn does not make much sense.
set maxconn global <maxconn>
Dynamically change the global maxconn setting within the range defined by the
initial global maxconn setting. If it is increased and connections were
pending, they will immediately be accepted. If it is lowered to a value below
the current number of connections, new connections acceptation will be
delayed until the threshold is reached. A value of zero restores the initial
setting.
set profiling { tasks | memory } { auto | on | off }
Enables or disables CPU or memory profiling for the indicated subsystem. This
is equivalent to setting or clearing the "profiling" settings in the "global"
section of the configuration file. Please also see "show profiling". Note
that manually setting the tasks profiling to "on" automatically resets the
scheduler statistics, thus allows to check activity over a given interval.
The memory profiling is limited to certain operating systems (known to work
on the linux-glibc target), and requires USE_MEMORY_PROFILING to be set at
compile time.
set rate-limit connections global <value>
Change the process-wide connection rate limit, which is set by the global
'maxconnrate' setting. A value of zero disables the limitation. This limit
applies to all frontends and the change has an immediate effect. The value
is passed in number of connections per second.
set rate-limit http-compression global <value>
Change the maximum input compression rate, which is set by the global
'maxcomprate' setting. A value of zero disables the limitation. The value is
passed in number of kilobytes per second. The value is available in the "show
info" on the line "CompressBpsRateLim" in bytes.
set rate-limit sessions global <value>
Change the process-wide session rate limit, which is set by the global
'maxsessrate' setting. A value of zero disables the limitation. This limit
applies to all frontends and the change has an immediate effect. The value
is passed in number of sessions per second.
set rate-limit ssl-sessions global <value>
Change the process-wide SSL session rate limit, which is set by the global
'maxsslrate' setting. A value of zero disables the limitation. This limit
applies to all frontends and the change has an immediate effect. The value
is passed in number of sessions per second sent to the SSL stack. It applies
before the handshake in order to protect the stack against handshake abuses.
set server <backend>/<server> addr <ip4 or ip6 address> [port <port>]
Replace the current IP address of a server by the one provided.
Optionally, the port can be changed using the 'port' parameter.
Note that changing the port also support switching from/to port mapping
(notation with +X or -Y), only if a port is configured for the health check.
set server <backend>/<server> agent [ up | down ]
Force a server's agent to a new state. This can be useful to immediately
switch a server's state regardless of some slow agent checks for example.
Note that the change is propagated to tracking servers if any.
set server <backend>/<server> agent-addr <addr> [port <port>]
Change addr for servers agent checks. Allows to migrate agent-checks to
another address at runtime. You can specify both IP and hostname, it will be
resolved.
Optionally, change the port agent.
set server <backend>/<server> agent-port <port>
Change the port used for agent checks.
set server <backend>/<server> agent-send <value>
Change agent string sent to agent check target. Allows to update string while
changing server address to keep those two matching.
set server <backend>/<server> health [ up | stopping | down ]
Force a server's health to a new state. This can be useful to immediately
switch a server's state regardless of some slow health checks for example.
Note that the change is propagated to tracking servers if any.
set server <backend>/<server> check-addr <ip4 | ip6> [port <port>]
Change the IP address used for server health checks.
Optionally, change the port used for server health checks.
set server <backend>/<server> check-port <port>
Change the port used for health checking to <port>
set server <backend>/<server> state [ ready | drain | maint ]
Force a server's administrative state to a new state. This can be useful to
disable load balancing and/or any traffic to a server. Setting the state to
"ready" puts the server in normal mode, and the command is the equivalent of
the "enable server" command. Setting the state to "maint" disables any traffic
to the server as well as any health checks. This is the equivalent of the
"disable server" command. Setting the mode to "drain" only removes the server
from load balancing but still allows it to be checked and to accept new
persistent connections. Changes are propagated to tracking servers if any.
set server <backend>/<server> weight <weight>[%]
Change a server's weight to the value passed in argument. This is the exact
equivalent of the "set weight" command below.
set server <backend>/<server> fqdn <FQDN>
Change a server's FQDN to the value passed in argument. This requires the
internal run-time DNS resolver to be configured and enabled for this server.
set server <backend>/<server> ssl [ on | off ] (deprecated)
This option configures SSL ciphering on outgoing connections to the server.
When switch off, all traffic becomes plain text; health check path is not
changed.

This command is deprecated, create a new server dynamically with or without
SSL instead, using the "add server" command.
set severity-output [ none | number | string ]
Change the severity output format of the stats socket connected to for the
duration of the current session.
set ssl ca-file <cafile> <payload>
this command is part of a transaction system, the "commit ssl ca-file" and
"abort ssl ca-file" commands could be required.
if there is no on-going transaction, it will create a ca file tree entry into
which the certificates contained in the payload will be stored. the ca file
entry will not be stored in the ca file tree and will only be kept in a
temporary transaction. if a transaction with the same filename already exists,
the previous ca file entry will be deleted and replaced by the new one.
once the modifications are done, you have to commit the transaction through
a "commit ssl ca-file" call. If you want to add multiple certificates
separately, you can use the "add ssl ca-file" command
Example:
echo -e "set ssl ca-file cafile.pem <<n$(cat rootCA.crt)n" |
socat /var/run/haproxy.stat -
echo "commit ssl ca-file cafile.pem" | socat /var/run/haproxy.stat -
set ssl cert <filename> <payload>
This command is part of a transaction system, the "commit ssl cert" and
"abort ssl cert" commands could be required.
This whole transaction system works on any certificate displayed by the
"show ssl cert" command, so on any frontend or backend certificate.
If there is no on-going transaction, it will duplicate the certificate
<filename> in memory to a temporary transaction, then update this
transaction with the PEM file in the payload. If a transaction exists with
the same filename, it will update this transaction. It's also possible to
update the files linked to a certificate (.issuer, .sctl, .oscp etc.)
Once the modification are done, you have to "commit ssl cert" the
transaction.

Injection of files over the CLI must be done with caution since an empty line
is used to notify the end of the payload. It is recommended to inject a PEM
file which has been sanitized. A simple method would be to remove every empty
line and only leave what are in the PEM sections. It could be achieved with a
sed command.
Example:
# With some simple sanitizing
 echo -e "set ssl cert localhost.pem <<n$(sed -n '/^$/d;/-BEGIN/,/-END/p' 127.0.0.1.pem)n" |
 socat /var/run/haproxy.stat -

 # Complete example with commit
 echo -e "set ssl cert localhost.pem <<n$(cat 127.0.0.1.pem)n" |
 socat /var/run/haproxy.stat -
 echo -e
 "set ssl cert localhost.pem.issuer <<n $(cat 127.0.0.1.pem.issuer)n" |
 socat /var/run/haproxy.stat -
 echo -e
 "set ssl cert localhost.pem.ocsp <<n$(base64 -w 1000 127.0.0.1.pem.ocsp)n" |
 socat /var/run/haproxy.stat -
 echo "commit ssl cert localhost.pem" | socat /var/run/haproxy.stat -
set ssl crl-file <crlfile> <payload>
This command is part of a transaction system, the "commit ssl crl-file" and
"abort ssl crl-file" commands could be required.
If there is no on-going transaction, it will create a CRL file tree entry into
which the Revocation Lists contained in the payload will be stored. The CRL
file entry will not be stored in the CRL file tree and will only be kept in a
temporary transaction. If a transaction with the same filename already exists,
the previous CRL file entry will be deleted and replaced by the new one.
Once the modifications are done, you have to commit the transaction through
a "commit ssl crl-file" call.
Example:
echo -e "set ssl crl-file crlfile.pem <<n$(cat rootCRL.pem)n" |
socat /var/run/haproxy.stat -
echo "commit ssl crl-file crlfile.pem" | socat /var/run/haproxy.stat -
set ssl ocsp-response <response | payload>
This command is used to update an OCSP Response for a certificate (see "crt"
on "bind" lines). Same controls are performed as during the initial loading of
the response. The <response> must be passed as a base64 encoded string of the
DER encoded response from the OCSP server. This command is not supported with
BoringSSL.
Example:
openssl ocsp -issuer issuer.pem -cert server.pem
             -host ocsp.issuer.com:80 -respout resp.der
echo "set ssl ocsp-response $(base64 -w 10000 resp.der)" |
             socat stdio /var/run/haproxy.stat

using the payload syntax:
echo -e "set ssl ocsp-response <<n$(base64 resp.der)n" |
             socat stdio /var/run/haproxy.stat
set ssl tls-key <id> <tlskey>
Set the next TLS key for the <id> listener to <tlskey>. This key becomes the
ultimate key, while the penultimate one is used for encryption (others just
decrypt). The oldest TLS key present is overwritten. <id> is either a numeric
#<id> or <file> returned by "show tls-keys". <tlskey> is a base64 encoded 48
or 80 bits TLS ticket key (ex. openssl rand 80 | openssl base64 -A).
set table <table> key <key> [data.<data_type> <value>]*
Create or update a stick-table entry in the table. If the key is not present,
an entry is inserted. See stick-table in section 4.2 to find all possible
values for <data_type>. The most likely use consists in dynamically entering
entries for source IP addresses, with a flag in gpc0 to dynamically block an
IP address or affect its quality of service. It is possible to pass multiple
data_types in a single call.
set timeout cli <delay>
Change the CLI interface timeout for current connection. This can be useful
during long debugging sessions where the user needs to constantly inspect
some indicators without being disconnected. The delay is passed in seconds.
set var <name> <expression>
set var <name> expr <expression>
set var <name> fmt <format>
Allows to set or overwrite the process-wide variable 'name' with the result
of expression <expression> or format string <format>. Only process-wide
variables may be used, so the name must begin with 'proc.' otherwise no
variable will be set. The <expression> and <format> may only involve
"internal" sample fetch keywords and converters even though the most likely
useful ones will be str('something'), int(), simple strings or references to
other variables. Note that the command line parser doesn't know about quotes,
so any space in the expression must be preceded by a backslash. This command
requires levels "operator" or "admin". This command is only supported on a
CLI connection running in experimental mode (see "experimental-mode on").
set weight <backend>/<server> <weight>[%]
Change a server's weight to the value passed in argument. If the value ends
with the '%' sign, then the new weight will be relative to the initially
configured weight.  Absolute weights are permitted between 0 and 256.
Relative weights must be positive with the resulting absolute weight is
capped at 256.  Servers which are part of a farm running a static
load-balancing algorithm have stricter limitations because the weight
cannot change once set. Thus for these servers, the only accepted values
are 0 and 100% (or 0 and the initial weight). Changes take effect
immediately, though certain LB algorithms require a certain amount of
requests to consider changes. A typical usage of this command is to
disable a server during an update by setting its weight to zero, then to
enable it again after the update by setting it back to 100%. This command
is restricted and can only be issued on sockets configured for level
"admin". Both the backend and the server may be specified either by their
name or by their numeric ID, prefixed with a sharp ('#').
show acl [[@<ver>] <acl>]
Dump info about acl converters. Without argument, the list of all available
acls is returned. If a <acl> is specified, its contents are dumped. <acl> is
the #<id> or <file>. By  default the current version of the ACL is shown (the
version currently being matched against and reported as 'curr_ver' in the ACL
list). It is possible to instead dump other versions by prepending '@<ver>'
before the ACL's identifier. The version works as a filter and non-existing
versions will simply report no result. The dump format is the same as for the
maps even for the sample values. The data returned are not a list of
available ACL, but are the list of all patterns composing any ACL. Many of
these patterns can be shared with maps. The 'entry_cnt' value represents the
count of all the ACL entries, not just the active ones, which means that it
also includes entries currently being added.
Display the current state of the anonymized mode (enabled or disabled) and
the current session's key.
Dump the list of backends available in the running process
Display the CLI level of the current CLI session. The result could be
'admin', 'operator' or 'user'. See also the 'operator' and 'user' commands.
Example :
$ socat /tmp/sock1 readline
prompt
> operator
> show cli level
operator
> user
> show cli level
user
> operator
Permission denied
Decrease the CLI level of the current CLI session to operator. It can't be
increased. It also drops expert and experimental mode. See also "show cli
level".
Decrease the CLI level of the current CLI session to user. It can't be
increased. It also drops expert and experimental mode. See also "show cli
level".
show activity [-1 | 0 | thread_num]
Reports some counters about internal events that will help developers and
more generally people who know haproxy well enough to narrow down the causes
of reports of abnormal behaviours. A typical example would be a properly
running process never sleeping and eating 100% of the CPU. The output fields
will be made of one line per metric, and per-thread counters on the same
line. These counters are 32-bit and will wrap during the process's life, which
is not a problem since calls to this command will typically be performed
twice. The fields are purposely not documented so that their exact meaning is
verified in the code where the counters are fed. These values are also reset
by the "clear counters" command. On multi-threaded deployments, the first
column will indicate the total (or average depending on the nature of the
metric) for all threads, and the list of all threads' values will be
represented between square brackets in the thread order. Optionally the
thread number to be dumped may be specified in argument. The special value
"0" will report the aggregated value (first column), and "-1", which is the
default, will display all the columns. Note that just like in single-threaded
mode, there will be no brackets when a single column is requested.
List CLI sockets. The output format is composed of 3 fields separated by
spaces. The first field is the socket address, it can be a unix socket, a
ipv4 address:port couple or a ipv6 one. Socket of other types won't be dump.
The second field describe the level of the socket: 'admin', 'user' or
'operator'. The last field list the processes on which the socket is bound,
separated by commas, it can be numbers or 'all'.
Example :
$ echo 'show cli sockets' | socat stdio /tmp/sock1
# socket lvl processes
/tmp/sock1 admin all
127.0.0.1:9999 user 2,3,4
127.0.0.2:9969 user 2
[::1]:9999 operator 2
List the configured caches and the objects stored in each cache tree.

$ echo 'show cache' | socat stdio /tmp/sock1
0x7f6ac6c5b03a: foobar (shctx:0x7f6ac6c5b000, available blocks:3918)
       1          2             3                             4

1. pointer to the cache structure
2. cache name
3. pointer to the mmap area (shctx)
4. number of blocks available for reuse in the shctx

0x7f6ac6c5b4cc hash:286881868 vary:0x0011223344556677 size:39114 (39 blocks), refcount:9, expire:237
         1               2               3                    4        5            6           7

1. pointer to the cache entry
2. first 32 bits of the hash
3. secondary hash of the entry in case of vary
4. size of the object in bytes
5. number of blocks used for the object
6. number of transactions using the entry
7. expiration time, can be negative if already expired
show env [<name>]
Dump one or all environment variables known by the process. Without any
argument, all variables are dumped. With an argument, only the specified
variable is dumped if it exists. Otherwise "Variable not found" is emitted.
Variables are dumped in the same format as they are stored or returned by the
"env" utility, that is, "<name>=<value>". This can be handy when debugging
certain configuration files making heavy use of environment variables to
ensure that they contain the expected values. This command is restricted and
can only be issued on sockets configured for levels "operator" or "admin".
show errors [<iid>|<proxy>] [request|response]
Dump last known request and response errors collected by frontends and
backends. If <iid> is specified, the limit the dump to errors concerning
either frontend or backend whose ID is <iid>. Proxy ID "-1" will cause
all instances to be dumped. If a proxy name is specified instead, its ID
will be used as the filter. If "request" or "response" is added after the
proxy name or ID, only request or response errors will be dumped. This
command is restricted and can only be issued on sockets configured for
levels "operator" or "admin".

The errors which may be collected are the last request and response errors
caused by protocol violations, often due to invalid characters in header
names. The report precisely indicates what exact character violated the
protocol. Other important information such as the exact date the error was
detected, frontend and backend names, the server name (when known), the
internal session ID and the source address which has initiated the session
are reported too.

All characters are returned, and non-printable characters are encoded. The
most common ones (t = 9, n = 10, r = 13 and e = 27) are encoded as one
letter following a backslash. The backslash itself is encoded as '\' to
avoid confusion. Other non-printable characters are encoded 'xNN' where
NN is the two-digits hexadecimal representation of the character's ASCII
code.

Lines are prefixed with the position of their first character, starting at 0
for the beginning of the buffer. At most one input line is printed per line,
and large lines will be broken into multiple consecutive output lines so that
the output never goes beyond 79 characters wide. It is easy to detect if a
line was broken, because it will not end with 'n' and the next line's offset
will be followed by a '+' sign, indicating it is a continuation of previous
line.
Example :
    $ echo "show errors -1 response" | socat stdio /tmp/sock1
>>> [04/Mar/2009:15:46:56.081] backend http-in (#2) : invalid response
      src 127.0.0.1, session #54, frontend fe-eth0 (#1), server s2 (#1)
      response length 213 bytes, error at position 23:

      00000  HTTP/1.0 200 OKrn
      00017  header/bizarre:blahrn
      00038  Location: blahrn
      00054  Long-line: this is a very long line which should b
      00104+ e broken into multiple lines on the output buffer,
      00154+  otherwise it would be too large to print in a ter
      00204+ minalrn
      00211  rn

In the example above, we see that the backend "http-in" which has internal
ID 2 has blocked an invalid response from its server s2 which has internal
ID 1. The request was on session 54 initiated by source 127.0.0.1 and
received by frontend fe-eth0 whose ID is 1. The total response length was
213 bytes when the error was detected, and the error was at byte 23. This
is the slash ('/') in header name "header/bizarre", which is not a valid
HTTP character for a header name.
show events [<sink>] [-w] [-n]
With no option, this lists all known event sinks and their types. With an
option, it will dump all available events in the designated sink if it is of
type buffer. If option "-w" is passed after the sink name, then once the end
of the buffer is reached, the command will wait for new events and display
them. It is possible to stop the operation by entering any input (which will
be discarded) or by closing the session. Finally, option "-n" is used to
directly seek to the end of the buffer, which is often convenient when
combined with "-w" to only report new events. For convenience, "-wn" or "-nw"
may be used to enable both options at once.
show fd [<fd>]
Dump the list of either all open file descriptors or just the one number <fd>
if specified. This is only aimed at developers who need to observe internal
states in order to debug complex issues such as abnormal CPU usages. One fd
is reported per lines, and for each of them, its state in the poller using
upper case letters for enabled flags and lower case for disabled flags, using
"P" for "polled", "R" for "ready", "A" for "active", the events status using
"H" for "hangup", "E" for "error", "O" for "output", "P" for "priority" and
"I" for "input", a few other flags like "N" for "new" (just added into the fd
cache), "U" for "updated" (received an update in the fd cache), "L" for
"linger_risk", "C" for "cloned", then the cached entry position, the pointer
to the internal owner, the pointer to the I/O callback and its name when
known. When the owner is a connection, the connection flags, and the target
are reported (frontend, proxy or server). When the owner is a listener, the
listener's state and its frontend are reported. There is no point in using
this command without a good knowledge of the internals. It's worth noting
that the output format may evolve over time so this output must not be parsed
by tools designed to be durable. Some internal structure states may look
suspicious to the function listing them, in this case the output line will be
suffixed with an exclamation mark ('!'). This may help find a starting point
when trying to diagnose an incident.
show info [typed|json] [desc] [float]
Dump info about haproxy status on current process. If "typed" is passed as an
optional argument, field numbers, names and types are emitted as well so that
external monitoring products can easily retrieve, possibly aggregate, then
report information found in fields they don't know. Each field is dumped on
its own line. If "json" is passed as an optional argument then
information provided by "typed" output is provided in JSON format as a
list of JSON objects. By default, the format contains only two columns
delimited by a colon (':'). The left one is the field name and the right
one is the value.  It is very important to note that in typed output
format, the dump for a single object is contiguous so that there is no
need for a consumer to store everything at once. If "float" is passed as an
optional argument, some fields usually emitted as integers may switch to
floats for higher accuracy. It is purposely unspecified which ones are
concerned as this might evolve over time. Using this option implies that the
consumer is able to process floats. The output format used is sprintf("%f").

When using the typed output format, each line is made of 4 columns delimited
by colons (':'). The first column is a dot-delimited series of 3 elements. The
first element is the numeric position of the field in the list (starting at
zero). This position shall not change over time, but holes are to be expected,
depending on build options or if some fields are deleted in the future. The
second element is the field name as it appears in the default "show info"
output. The third element is the relative process number starting at 1.

The rest of the line starting after the first colon follows the "typed output
format" described in the section above. In short, the second column (after the
first ':') indicates the origin, nature and scope of the variable. The third
column indicates the type of the field, among "s32", "s64", "u32", "u64" and
"str". Then the fourth column is the value itself, which the consumer knows
how to parse thanks to column 3 and how to process thanks to column 2.

Thus the overall line format in typed mode is :

    <field_pos>.<field_name>.<process_num>:<tags>:<type>:<value>

When "desc" is appended to the command, one extra colon followed by a quoted
string is appended with a description for the metric. At the time of writing,
this is only supported for the "typed" and default output formats.
Example :
> show info
Name: HAProxy
Version: 1.7-dev1-de52ea-146
Release_date: 2016/03/11
Nbproc: 1
Process_num: 1
Pid: 28105
Uptime: 0d 0h00m04s
Uptime_sec: 4
Memmax_MB: 0
PoolAlloc_MB: 0
PoolUsed_MB: 0
PoolFailed: 0
(...)

> show info typed
0.Name.1:POS:str:HAProxy
1.Version.1:POS:str:1.7-dev1-de52ea-146
2.Release_date.1:POS:str:2016/03/11
3.Nbproc.1:CGS:u32:1
4.Process_num.1:KGP:u32:1
5.Pid.1:SGP:u32:28105
6.Uptime.1:MDP:str:0d 0h00m08s
7.Uptime_sec.1:MDP:u32:8
8.Memmax_MB.1:CLP:u32:0
9.PoolAlloc_MB.1:MGP:u32:0
10.PoolUsed_MB.1:MGP:u32:0
11.PoolFailed.1:MCP:u32:0
(...)
In the typed format, the presence of the process ID at the end of the
first column makes it very easy to visually aggregate outputs from
multiple processes.
Example :
$ ( echo show info typed | socat /var/run/haproxy.sock1 ;
    echo show info typed | socat /var/run/haproxy.sock2 ) |
  sort -t . -k 1,1n -k 2,2 -k 3,3n
0.Name.1:POS:str:HAProxy
0.Name.2:POS:str:HAProxy
1.Version.1:POS:str:1.7-dev1-868ab3-148
1.Version.2:POS:str:1.7-dev1-868ab3-148
2.Release_date.1:POS:str:2016/03/11
2.Release_date.2:POS:str:2016/03/11
3.Nbproc.1:CGS:u32:2
3.Nbproc.2:CGS:u32:2
4.Process_num.1:KGP:u32:1
4.Process_num.2:KGP:u32:2
5.Pid.1:SGP:u32:30120
5.Pid.2:SGP:u32:30121
6.Uptime.1:MDP:str:0d 0h01m28s
6.Uptime.2:MDP:str:0d 0h01m28s
(...)
The format of JSON output is described in a schema which may be output
using "show schema json".

The JSON output contains no extra whitespace in order to reduce the
volume of output. For human consumption passing the output through a
pretty printer may be helpful. Example :

$ echo "show info json" | socat /var/run/haproxy.sock stdio |
  python -m json.tool

The JSON output contains no extra whitespace in order to reduce the
volume of output. For human consumption passing the output through a
pretty printer may be helpful. Example :

$ echo "show info json" | socat /var/run/haproxy.sock stdio |
  python -m json.tool
Dump the list of loaded shared dynamic libraries and object files, on systems
that support it. When available, for each shared object the range of virtual
addresses will be indicated, the size and the path to the object. This can be
used for example to try to estimate what library provides a function that
appears in a dump. Note that on many systems, addresses will change upon each
restart (address space randomization), so that this list would need to be
retrieved upon startup if it is expected to be used to analyse a core file.
This command may only be issued on sockets configured for levels "operator"
or "admin". Note that the output format may vary between operating systems,
architectures and even haproxy versions, and ought not to be relied on in
scripts.
show map [[@<ver>] <map>]
Dump info about map converters. Without argument, the list of all available
maps is returned. If a <map> is specified, its contents are dumped. <map> is
the #<id> or <file>. By  default the current version of the map is shown (the
version currently being matched against and reported as 'curr_ver' in the map
list). It is possible to instead dump other versions by prepending '@<ver>'
before the map's identifier. The version works as a filter and non-existing
versions will simply report no result. The 'entry_cnt' value represents the
count of all the map entries, not just the active ones, which means that it
also includes entries currently being added.

In the output, the first column is a unique entry identifier, which is usable
as a reference for operations "del map" and "set map". The second column is
the pattern and the third column is the sample if available. The data returned
are not directly a list of available maps, but are the list of all patterns
composing any map. Many of these patterns can be shared with ACL.
show peers [dict|-] [<peers section>]
Dump info about the peers configured in "peers" sections. Without argument,
the list of the peers belonging to all the "peers" sections are listed. If
<peers section> is specified, only the information about the peers belonging
to this "peers" section are dumped. When "dict" is specified before the peers
section name, the entire Tx/Rx dictionary caches will also be dumped (very
large). Passing "-" may be required to dump a peers section called "dict".

Here are two examples of outputs where hostA, hostB and hostC peers belong to
"sharedlb" peers sections. Only hostA and hostB are connected. Only hostA has
sent data to hostB.

$ echo "show peers" | socat - /tmp/hostA
0x55deb0224320: [15/Apr/2019:11:28:01] id=sharedlb state=0 flags=0x3
  resync_timeout=<PAST> task_calls=45122
    0x55deb022b540: id=hostC(remote) addr=127.0.0.12:10002 status=CONN
      reconnect=4s confirm=0
      flags=0x0
    0x55deb022a440: id=hostA(local) addr=127.0.0.10:10000 status=NONE
      reconnect=<NEVER> confirm=0
      flags=0x0
    0x55deb0227d70: id=hostB(remote) addr=127.0.0.11:10001 status=ESTA
      reconnect=2s confirm=0
      flags=0x20000200 appctx:0x55deb028fba0 st0=7 st1=0 task_calls=14456
        state=EST
      xprt=RAW src=127.0.0.1:37257 addr=127.0.0.10:10000
      remote_table:0x55deb0224a10 id=stkt local_id=1 remote_id=1
      last_local_table:0x55deb0224a10 id=stkt local_id=1 remote_id=1
      shared tables:
        0x55deb0224a10 local_id=1 remote_id=1 flags=0x0 remote_data=0x65
          last_acked=0 last_pushed=3 last_get=0 teaching_origin=0 update=3
          table:0x55deb022d6a0 id=stkt update=3 localupdate=3
            commitupdate=3 syncing=0

$ echo "show peers" | socat - /tmp/hostB
0x55871b5ab320: [15/Apr/2019:11:28:03] id=sharedlb state=0 flags=0x3
  resync_timeout=<PAST> task_calls=3
    0x55871b5b2540: id=hostC(remote) addr=127.0.0.12:10002 status=CONN
      reconnect=3s confirm=0
      flags=0x0
    0x55871b5b1440: id=hostB(local) addr=127.0.0.11:10001 status=NONE
      reconnect=<NEVER> confirm=0
      flags=0x0
    0x55871b5aed70: id=hostA(remote) addr=127.0.0.10:10000 status=ESTA
      reconnect=2s confirm=0
      flags=0x20000200 appctx:0x7fa46800ee00 st0=7 st1=0 task_calls=62356
        state=EST
      remote_table:0x55871b5ab960 id=stkt local_id=1 remote_id=1
      last_local_table:0x55871b5ab960 id=stkt local_id=1 remote_id=1
      shared tables:
        0x55871b5ab960 local_id=1 remote_id=1 flags=0x0 remote_data=0x65
          last_acked=3 last_pushed=0 last_get=3 teaching_origin=0 update=0
          table:0x55871b5b46a0 id=stkt update=1 localupdate=0
            commitupdate=0 syncing=0
show pools [byname|bysize|byusage] [match <pfx>] [<nb>]
Dump the status of internal memory pools. This is useful to track memory
usage when suspecting a memory leak for example. It does exactly the same
as the SIGQUIT when running in foreground except that it does not flush the
pools. The output is not sorted by default. If "byname" is specified, it is
sorted by pool name; if "bysize" is specified, it is sorted by item size in
reverse order; if "byusage" is specified, it is sorted by total usage in
reverse order, and only used entries are shown. It is also possible to limit
the output to the <nb> first entries (e.g. when sorting by usage). Finally,
if "match" followed by a prefix is specified, then only pools whose name
starts with this prefix will be shown. The reported total only concerns pools
matching the filtering criteria. Example:

  $ socat - /tmp/haproxy.sock <<< "show pools match quic byusage"
  Dumping pools usage. Use SIGQUIT to flush them.
    - Pool quic_conn_r (65560 bytes) : 1337 allocated (87653720 bytes), ...
    - Pool quic_crypto (1048 bytes) : 6685 allocated (7005880 bytes), ...
    - Pool quic_conn (4056 bytes) : 1337 allocated (5422872 bytes), ...
    - Pool quic_rxbuf (262168 bytes) : 8 allocated (2097344 bytes), ...
    - Pool quic_connne (184 bytes) : 9359 allocated (1722056 bytes), ...
    - Pool quic_frame (184 bytes) : 7938 allocated (1460592 bytes), ...
    - Pool quic_tx_pac (152 bytes) : 6454 allocated (981008 bytes), ...
    - Pool quic_tls_ke (56 bytes) : 12033 allocated (673848 bytes), ...
    - Pool quic_rx_pac (408 bytes) : 1596 allocated (651168 bytes), ...
    - Pool quic_tls_se (88 bytes) : 6685 allocated (588280 bytes), ...
    - Pool quic_cstrea (88 bytes) : 4011 allocated (352968 bytes), ...
    - Pool quic_tls_iv (24 bytes) : 12033 allocated (288792 bytes), ...
    - Pool quic_dgram (344 bytes) : 732 allocated (251808 bytes), ...
    - Pool quic_arng (56 bytes) : 4011 allocated (224616 bytes), ...
    - Pool quic_conn_c (152 bytes) : 1337 allocated (203224 bytes), ...
  Total: 15 pools, 109578176 bytes allocated, 109578176 used ...
show profiling [{all | status | tasks | memory}] [byaddr|bytime|aggr|<max_lines>]*
Dumps the current profiling settings, one per line, as well as the command
needed to change them. When tasks profiling is enabled, some per-function
statistics collected by the scheduler will also be emitted, with a summary
covering the number of calls, total/avg CPU time and total/avg latency. When
memory profiling is enabled, some information such as the number of
allocations/releases and their sizes will be reported. It is possible to
limit the dump to only the profiling status, the tasks, or the memory
profiling by specifying the respective keywords; by default all profiling
information are dumped. It is also possible to limit the number of lines
of output of each category by specifying a numeric limit. If is possible to
request that the output is sorted by address or by total execution time
instead of usage, e.g. to ease comparisons between subsequent calls or to
check what needs to be optimized, and to aggregate task activity by called
function instead of seeing the details. Please note that profiling is
essentially aimed at developers since it gives hints about where CPU cycles
or memory are wasted in the code. There is nothing useful to monitor there.
show resolvers [<resolvers section id>]
Dump statistics for the given resolvers section, or all resolvers sections
if no section is supplied.

For each name server, the following counters are reported:
  sent: number of DNS requests sent to this server
  valid: number of DNS valid responses received from this server
  update: number of DNS responses used to update the server's IP address
  cname: number of CNAME responses
  cname_error: CNAME errors encountered with this server
  any_err: number of empty response (IE: server does not support ANY type)
  nx: non existent domain response received from this server
  timeout: how many time this server did not answer in time
  refused: number of requests refused by this server
  other: any other DNS errors
  invalid: invalid DNS response (from a protocol point of view)
  too_big: too big response
  outdated: number of response arrived too late (after an other name server)
show servers conn [<backend>]
Dump the current and idle connections state of the servers belonging to the
designated backend (or all backends if none specified). A backend name or
identifier may be used.

The output consists in a header line showing the fields titles, then one
server per line with for each, the backend name and ID, server name and ID,
the address, port and a series or values. The number of fields varies
depending on thread count.

Given the threaded nature of idle connections, it's important to understand
that some values may change once read, and that as such, consistency within a
line isn't granted. This output is mostly provided as a debugging tool and is
not relevant to be routinely monitored nor graphed.
show servers state [<backend>]
Dump the state of the servers found in the running configuration. A backend
name or identifier may be provided to limit the output to this backend only.

The dump has the following format:
 - first line contains the format version (1 in this specification);
 - second line contains the column headers, prefixed by a sharp ('#');
 - third line and next ones contain data;
 - each line starting by a sharp ('#') is considered as a comment.

Since multiple versions of the output may co-exist, below is the list of
fields and their order per file format version :
 1:
   be_id:                       Backend unique id.
   be_name:                     Backend label.
   srv_id:                      Server unique id (in the backend).
   srv_name:                    Server label.
   srv_addr:                    Server IP address.
   srv_op_state:                Server operational state (UP/DOWN/...).
                                  0 = SRV_ST_STOPPED
                                    The server is down.
                                  1 = SRV_ST_STARTING
                                    The server is warming up (up but
                                    throttled).
                                  2 = SRV_ST_RUNNING
                                    The server is fully up.
                                  3 = SRV_ST_STOPPING
                                    The server is up but soft-stopping
                                    (eg: 404).
   srv_admin_state:             Server administrative state (MAINT/DRAIN/...).
                                The state is actually a mask of values :
                                  0x01 = SRV_ADMF_FMAINT
                                    The server was explicitly forced into
                                    maintenance.
                                  0x02 = SRV_ADMF_IMAINT
                                    The server has inherited the maintenance
                                    status from a tracked server.
                                  0x04 = SRV_ADMF_CMAINT
                                    The server is in maintenance because of
                                    the configuration.
                                  0x08 = SRV_ADMF_FDRAIN
                                    The server was explicitly forced into
                                    drain state.
                                  0x10 = SRV_ADMF_IDRAIN
                                    The server has inherited the drain status
                                    from a tracked server.
                                  0x20 = SRV_ADMF_RMAINT
                                    The server is in maintenance because of an
                                    IP address resolution failure.
                                  0x40 = SRV_ADMF_HMAINT
                                    The server FQDN was set from stats socket.

   srv_uweight:                 User visible server's weight.
   srv_iweight:                 Server's initial weight.
   srv_time_since_last_change:  Time since last operational change.
   srv_check_status:            Last health check status.
   srv_check_result:            Last check result (FAILED/PASSED/...).
                                  0 = CHK_RES_UNKNOWN
                                    Initialized to this by default.
                                  1 = CHK_RES_NEUTRAL
                                    Valid check but no status information.
                                  2 = CHK_RES_FAILED
                                    Check failed.
                                  3 = CHK_RES_PASSED
                                    Check succeeded and server is fully up
                                    again.
                                  4 = CHK_RES_CONDPASS
                                    Check reports the server doesn't want new
                                    sessions.
   srv_check_health:            Checks rise / fall current counter.
   srv_check_state:             State of the check (ENABLED/PAUSED/...).
                                The state is actually a mask of values :
                                  0x01 = CHK_ST_INPROGRESS
                                    A check is currently running.
                                  0x02 = CHK_ST_CONFIGURED
                                    This check is configured and may be
                                    enabled.
                                  0x04 = CHK_ST_ENABLED
                                    This check is currently administratively
                                    enabled.
                                  0x08 = CHK_ST_PAUSED
                                    Checks are paused because of maintenance
                                    (health only).
   srv_agent_state:             State of the agent check (ENABLED/PAUSED/...).
                                This state uses the same mask values as
                                "srv_check_state", adding this specific one :
                                  0x10 = CHK_ST_AGENT
                                    Check is an agent check (otherwise it's a
                                    health check).
   bk_f_forced_id:              Flag to know if the backend ID is forced by
                                configuration.
   srv_f_forced_id:             Flag to know if the server's ID is forced by
                                configuration.
   srv_fqdn:                    Server FQDN.
   srv_port:                    Server port.
   srvrecord:                   DNS SRV record associated to this SRV.
   srv_use_ssl:                 use ssl for server connections.
   srv_check_port:              Server health check port.
   srv_check_addr:              Server health check address.
   srv_agent_addr:              Server health agent address.
   srv_agent_port:              Server health agent port.
Dump all known sessions. Avoid doing this on slow connections as this can
be huge. This command is restricted and can only be issued on sockets
configured for levels "operator" or "admin". Note that on machines with
quickly recycled connections, it is possible that this output reports less
entries than really exist because it will dump all existing sessions up to
the last one that was created before the command was entered; those which
die in the mean time will not appear.
show sess <id>
Display a lot of internal information about the specified session identifier.
This identifier is the first field at the beginning of the lines in the dumps
of "show sess" (it corresponds to the session pointer). Those information are
useless to most users but may be used by haproxy developers to troubleshoot a
complex bug. The output format is intentionally not documented so that it can
freely evolve depending on demands. You may find a description of all fields
returned in src/dumpstats.c

The special id "all" dumps the states of all sessions, which must be avoided
as much as possible as it is highly CPU intensive and can take a lot of time.
show stat [domain <dns|proxy>] [{<iid>|<proxy>} <type> <sid>] [typed|json]
[desc] [up|no-maint]
Dump statistics. The domain is used to select which statistics to print; dns
and proxy are available for now. By default, the CSV format is used; you can
activate the extended typed output format described in the section above if
"typed" is passed after the other arguments; or in JSON if "json" is passed
after the other arguments. By passing <id>, <type> and <sid>, it is possible
to dump only selected items :
  - <iid> is a proxy ID, -1 to dump everything. Alternatively, a proxy name
    <proxy> may be specified. In this case, this proxy's ID will be used as
    the ID selector.
  - <type> selects the type of dumpable objects : 1 for frontends, 2 for
     backends, 4 for servers, -1 for everything. These values can be ORed,
     for example:
        1 + 2     = 3   -> frontend + backend.
        1 + 2 + 4 = 7   -> frontend + backend + server.
  - <sid> is a server ID, -1 to dump everything from the selected proxy.
Example :
    $ echo "show info;show stat" | socat stdio unix-connect:/tmp/sock1
>>> Name: HAProxy
    Version: 1.4-dev2-49
    Release_date: 2009/09/23
    Nbproc: 1
    Process_num: 1
    (...)

    # pxname,svname,qcur,qmax,scur,smax,slim,stot,bin,bout,dreq,  (...)
    stats,FRONTEND,,,0,0,1000,0,0,0,0,0,0,,,,,OPEN,,,,,,,,,1,1,0, (...)
    stats,BACKEND,0,0,0,0,1000,0,0,0,0,0,,0,0,0,0,UP,0,0,0,,0,250,(...)
    (...)
    www1,BACKEND,0,0,0,0,1000,0,0,0,0,0,,0,0,0,0,UP,1,1,0,,0,250, (...)

    $
In this example, two commands have been issued at once. That way it's easy to
find which process the stats apply to in multi-process mode. This is not
needed in the typed output format as the process number is reported on each
line.  Notice the empty line after the information output which marks the end
of the first block.  A similar empty line appears at the end of the second
block (stats) so that the reader knows the output has not been truncated.

When "typed" is specified, the output format is more suitable to monitoring
tools because it provides numeric positions and indicates the type of each
output field. Each value stands on its own line with process number, element
number, nature, origin and scope. This same format is available via the HTTP
stats by passing ";typed" after the URI. It is very important to note that in
typed output format, the dump for a single object is contiguous so that there
is no need for a consumer to store everything at once.

The "up" modifier will result in listing only servers which reportedly up or
not checked. Those down, unresolved, or in maintenance will not be listed.
This is analogous to the ";up" option on the HTTP stats. Similarly, the
"no-maint" modifier will act like the ";no-maint" HTTP modifier and will
result in disabled servers not to be listed. The difference is that those
which are enabled but down will not be evicted.

When using the typed output format, each line is made of 4 columns delimited
by colons (':'). The first column is a dot-delimited series of 5 elements. The
first element is a letter indicating the type of the object being described.
At the moment the following object types are known : 'F' for a frontend, 'B'
for a backend, 'L' for a listener, and 'S' for a server. The second element
The second element is a positive integer representing the unique identifier of
the proxy the object belongs to. It is equivalent to the "iid" column of the
CSV output and matches the value in front of the optional "id" directive found
in the frontend or backend section. The third element is a positive integer
containing the unique object identifier inside the proxy, and corresponds to
the "sid" column of the CSV output. ID 0 is reported when dumping a frontend
or a backend. For a listener or a server, this corresponds to their respective
ID inside the proxy. The fourth element is the numeric position of the field
in the list (starting at zero). This position shall not change over time, but
holes are to be expected, depending on build options or if some fields are
deleted in the future. The fifth element is the field name as it appears in
the CSV output. The sixth element is a positive integer and is the relative
process number starting at 1.

The rest of the line starting after the first colon follows the "typed output
format" described in the section above. In short, the second column (after the
first ':') indicates the origin, nature and scope of the variable. The third
column indicates the field type, among "s32", "s64", "u32", "u64", "flt' and
"str". Then the fourth column is the value itself, which the consumer knows
how to parse thanks to column 3 and how to process thanks to column 2.

When "desc" is appended to the command, one extra colon followed by a quoted
string is appended with a description for the metric. At the time of writing,
this is only supported for the "typed" output format.

Thus the overall line format in typed mode is :

    <obj>.<px_id>.<id>.<fpos>.<fname>.<process_num>:<tags>:<type>:<value>

Here's an example of typed output format :

      $ echo "show stat typed" | socat stdio unix-connect:/tmp/sock1
      F.2.0.0.pxname.1:MGP:str:private-frontend
      F.2.0.1.svname.1:MGP:str:FRONTEND
      F.2.0.8.bin.1:MGP:u64:0
      F.2.0.9.bout.1:MGP:u64:0
      F.2.0.40.hrsp_2xx.1:MGP:u64:0
      L.2.1.0.pxname.1:MGP:str:private-frontend
      L.2.1.1.svname.1:MGP:str:sock-1
      L.2.1.17.status.1:MGP:str:OPEN
      L.2.1.73.addr.1:MGP:str:0.0.0.0:8001
      S.3.13.60.rtime.1:MCP:u32:0
      S.3.13.61.ttime.1:MCP:u32:0
      S.3.13.62.agent_status.1:MGP:str:L4TOUT
      S.3.13.64.agent_duration.1:MGP:u64:2001
      S.3.13.65.check_desc.1:MCP:str:Layer4 timeout
      S.3.13.66.agent_desc.1:MCP:str:Layer4 timeout
      S.3.13.67.check_rise.1:MCP:u32:2
      S.3.13.68.check_fall.1:MCP:u32:3
      S.3.13.69.check_health.1:SGP:u32:0
      S.3.13.70.agent_rise.1:MaP:u32:1
      S.3.13.71.agent_fall.1:SGP:u32:1
      S.3.13.72.agent_health.1:SGP:u32:1
      S.3.13.73.addr.1:MCP:str:1.255.255.255:8888
      S.3.13.75.mode.1:MAP:str:http
      B.3.0.0.pxname.1:MGP:str:private-backend
      B.3.0.1.svname.1:MGP:str:BACKEND
      B.3.0.2.qcur.1:MGP:u32:0
      B.3.0.3.qmax.1:MGP:u32:0
      B.3.0.4.scur.1:MGP:u32:0
      B.3.0.5.smax.1:MGP:u32:0
      B.3.0.6.slim.1:MGP:u32:1000
      B.3.0.55.lastsess.1:MMP:s32:-1
      (...)

In the typed format, the presence of the process ID at the end of the
first column makes it very easy to visually aggregate outputs from
multiple processes, as show in the example below where each line appears
for each process :

      $ ( echo show stat typed | socat /var/run/haproxy.sock1 - ;
          echo show stat typed | socat /var/run/haproxy.sock2 - ) |
        sort -t . -k 1,1 -k 2,2n -k 3,3n -k 4,4n -k 5,5 -k 6,6n
      B.3.0.0.pxname.1:MGP:str:private-backend
      B.3.0.0.pxname.2:MGP:str:private-backend
      B.3.0.1.svname.1:MGP:str:BACKEND
      B.3.0.1.svname.2:MGP:str:BACKEND
      B.3.0.2.qcur.1:MGP:u32:0
      B.3.0.2.qcur.2:MGP:u32:0
      B.3.0.3.qmax.1:MGP:u32:0
      B.3.0.3.qmax.2:MGP:u32:0
      B.3.0.4.scur.1:MGP:u32:0
      B.3.0.4.scur.2:MGP:u32:0
      B.3.0.5.smax.1:MGP:u32:0
      B.3.0.5.smax.2:MGP:u32:0
      B.3.0.6.slim.1:MGP:u32:1000
      B.3.0.6.slim.2:MGP:u32:1000
      (...)

The format of JSON output is described in a schema which may be output
using "show schema json".

The JSON output contains no extra whitespace in order to reduce the
volume of output. For human consumption passing the output through a
pretty printer may be helpful. Example :

$ echo "show stat json" | socat /var/run/haproxy.sock stdio |
  python -m json.tool

The JSON output contains no extra whitespace in order to reduce the
volume of output. For human consumption passing the output through a
pretty printer may be helpful. Example :

$ echo "show stat json" | socat /var/run/haproxy.sock stdio |
  python -m json.tool
show ssl ca-file [<cafile>[:<index>]]
Display the list of CA files loaded into the process and their respective
certificate counts. The certificates are not used by any frontend or backend
until their status is "Used".
A "@system-ca" entry can appear in the list, it is loaded by the httpclient
by default. It contains the list of trusted CA of your system returned by
OpenSSL.
If a filename is prefixed by an asterisk, it is a transaction which
is not committed yet. If a <cafile> is specified without <index>, it will show
the status of the CA file ("Used"/"Unused") followed by details about all the
certificates contained in the CA file. The details displayed for every
certificate are the same as the ones displayed by a "show ssl cert" command.
If a <cafile> is specified followed by an <index>, it will only display the
details of the certificate having the specified index. Indexes start from 1.
If the index is invalid (too big for instance), nothing will be displayed.
This command can be useful to check if a CA file was properly updated.
You can also display the details of an ongoing transaction by prefixing the
filename by an asterisk.
Example :
$ echo "show ssl ca-file" | socat /var/run/haproxy.master -
# transaction
*cafile.crt - 2 certificate(s)
# filename
cafile.crt - 1 certificate(s)

$ echo "show ssl ca-file cafile.crt" | socat /var/run/haproxy.master -
Filename: /home/tricot/work/haproxy/reg-tests/ssl/set_cafile_ca2.crt
Status: Used

Certificate #1:
Serial: 11A4D2200DC84376E7D233CAFF39DF44BF8D1211
notBefore: Apr  1 07:40:53 2021 GMT
notAfter: Aug 17 07:40:53 2048 GMT
Subject Alternative Name:
Algorithm: RSA4096
SHA1 FingerPrint: A111EF0FEFCDE11D47FE3F33ADCA8435EBEA4864
Subject: /C=FR/ST=Some-State/O=HAProxy Technologies/CN=HAProxy Technologies CA
Issuer: /C=FR/ST=Some-State/O=HAProxy Technologies/CN=HAProxy Technologies CA

$ echo "show ssl ca-file *cafile.crt:2" | socat /var/run/haproxy.master -
Filename: */home/tricot/work/haproxy/reg-tests/ssl/set_cafile_ca2.crt
Status: Unused

Certificate #2:
Serial: 587A1CE5ED855040A0C82BF255FF300ADB7C8136
[...]
show ssl cert [<filename>]
Display the list of certificates loaded into the process. They are not used
by any frontend or backend until their status is "Used".
If a filename is prefixed by an asterisk, it is a transaction which is not
committed yet. If a filename is specified, it will show details about the
certificate. This command can be useful to check if a certificate was well
updated. You can also display details on a transaction by prefixing the
filename by an asterisk.
This command can also be used to display the details of a certificate's OCSP
response by suffixing the filename with a ".ocsp" extension. It works for
committed certificates as well as for ongoing transactions. On a committed
certificate, this command is equivalent to calling "show ssl ocsp-response"
with the certificate's corresponding OCSP response ID.
Example :
$ echo "@1 show ssl cert" | socat /var/run/haproxy.master -
# transaction
*test.local.pem
# filename
test.local.pem

$ echo "@1 show ssl cert test.local.pem" | socat /var/run/haproxy.master -
Filename: test.local.pem
Status: Used
Serial: 03ECC19BA54B25E85ABA46EE561B9A10D26F
notBefore: Sep 13 21:20:24 2019 GMT
notAfter: Dec 12 21:20:24 2019 GMT
Issuer: /C=US/O=Let's Encrypt/CN=Let's Encrypt Authority X3
Subject: /CN=test.local
Subject Alternative Name: DNS:test.local, DNS:imap.test.local
Algorithm: RSA2048
SHA1 FingerPrint: 417A11CAE25F607B24F638B4A8AEE51D1E211477

$ echo "@1 show ssl cert *test.local.pem" | socat /var/run/haproxy.master -
Filename: *test.local.pem
Status: Unused
[...]
show ssl crl-file [<crlfile>[:<index>]]
Display the list of CRL files loaded into the process. They are not used
by any frontend or backend until their status is "Used".
If a filename is prefixed by an asterisk, it is a transaction which is not
committed yet. If a <crlfile> is specified without <index>, it will show the
status of the CRL file ("Used"/"Unused") followed by details about all the
Revocation Lists contained in the CRL file. The details displayed for every
list are based on the output of "openssl crl -text -noout -in <file>".
If a <crlfile> is specified followed by an <index>, it will only display the
details of the list having the specified index. Indexes start from 1.
If the index is invalid (too big for instance), nothing will be displayed.
This command can be useful to check if a CRL file was properly updated.
You can also display the details of an ongoing transaction by prefixing the
filename by an asterisk.
Example :
$ echo "show ssl crl-file" | socat /var/run/haproxy.master -
# transaction
*crlfile.pem
# filename
crlfile.pem

$ echo "show ssl crl-file crlfile.pem" | socat /var/run/haproxy.master -
Filename: /home/tricot/work/haproxy/reg-tests/ssl/crlfile.pem
Status: Used

Certificate Revocation List #1:
Version 1
Signature Algorithm: sha256WithRSAEncryption
Issuer: /C=FR/O=HAProxy Technologies/CN=Intermediate CA2
Last Update: Apr 23 14:45:39 2021 GMT
Next Update: Sep  8 14:45:39 2048 GMT
Revoked Certificates:
    Serial Number: 1008
        Revocation Date: Apr 23 14:45:36 2021 GMT

Certificate Revocation List #2:
Version 1
Signature Algorithm: sha256WithRSAEncryption
Issuer: /C=FR/O=HAProxy Technologies/CN=Root CA
Last Update: Apr 23 14:30:44 2021 GMT
Next Update: Sep  8 14:30:44 2048 GMT
No Revoked Certificates.
show ssl crt-list [-n] [<filename>]
Display the list of crt-list and directories used in the HAProxy
configuration. If a filename is specified, dump the content of a crt-list or
a directory. Once dumped the output can be used as a crt-list file.
The '-n' option can be used to display the line number, which is useful when
combined with the 'del ssl crt-list' option when a entry is duplicated. The
output with the '-n' option is not compatible with the crt-list format and
not loadable by haproxy.
Example:
echo "show ssl crt-list -n localhost.crt-list" | socat /tmp/sock1 -
# localhost.crt-list
common.pem:1 !not.test1.com *.test1.com !localhost
common.pem:2
ecdsa.pem:3 [verify none allow-0rtt ssl-min-ver TLSv1.0 ssl-max-ver TLSv1.3] localhost !www.test1.com
ecdsa.pem:4 [verify none allow-0rtt ssl-min-ver TLSv1.0 ssl-max-ver TLSv1.3]
show ssl ocsp-response [<id>]
Display the IDs of the OCSP tree entries corresponding to all the OCSP
responses used in HAProxy, as well as the issuer's name and key hash and the
serial number of the certificate for which the OCSP response was built.
If a valid <id> is provided, display the contents of the corresponding OCSP
response. The information displayed is the same as in an "openssl ocsp -respin
<ocsp-response> -text" call.
Example :
$ echo "show ssl ocsp-response" | socat /var/run/haproxy.master -
# Certificate IDs
  Certificate ID key : 303b300906052b0e03021a050004148a83e0060faff709ca7e9b95522a2e81635fda0a0414f652b0e435d5ea923851508f0adbe92d85de007a0202100a
    Certificate ID:
      Issuer Name Hash: 8A83E0060FAFF709CA7E9B95522A2E81635FDA0A
      Issuer Key Hash: F652B0E435D5EA923851508F0ADBE92D85DE007A
      Serial Number: 100A

$ echo "show ssl ocsp-response 303b300906052b0e03021a050004148a83e0060faff709ca7e9b95522a2e81635fda0a0414f652b0e435d5ea923851508f0adbe92d85de007a0202100a" | socat /var/run/haproxy.master -
OCSP Response Data:
  OCSP Response Status: successful (0x0)
  Response Type: Basic OCSP Response
  Version: 1 (0x0)
  Responder Id: C = FR, O = HAProxy Technologies, CN = ocsp.haproxy.com
  Produced At: May 27 15:43:38 2021 GMT
  Responses:
  Certificate ID:
    Hash Algorithm: sha1
    Issuer Name Hash: 8A83E0060FAFF709CA7E9B95522A2E81635FDA0A
    Issuer Key Hash: F652B0E435D5EA923851508F0ADBE92D85DE007A
    Serial Number: 100A
  Cert Status: good
  This Update: May 27 15:43:38 2021 GMT
  Next Update: Oct 12 15:43:38 2048 GMT
  [...]
Display the names of the providers loaded by OpenSSL during init. Provider
loading can indeed be configured via the OpenSSL configuration file and this
option allows to check that the right providers were loaded. This command is
only available with OpenSSL v3.
Example :
$ echo "show ssl providers" | socat /var/run/haproxy.master -
Loaded providers :
    - fips
    - base
Dump all messages emitted during the startup of the current haproxy process,
each startup-logs buffer is unique to its haproxy worker.

This keyword also exists on the master CLI, which shows the latest startup or
reload tentative.
Dump general information on all known stick-tables. Their name is returned
(the name of the proxy which holds them), their type (currently zero, always
IP), their size in maximum possible number of entries, and the number of
entries currently in use.
Example :
    $ echo "show table" | socat stdio /tmp/sock1
>>> # table: front_pub, type: ip, size:204800, used:171454
>>> # table: back_rdp, type: ip, size:204800, used:0
show table <name> [ data.<type> <operator> <value> [data.<type> …]] | [ key <key> ]
Dump contents of stick-table <name>. In this mode, a first line of generic
information about the table is reported as with "show table", then all
entries are dumped. Since this can be quite heavy, it is possible to specify
a filter in order to specify what entries to display.

When the "data." form is used the filter applies to the stored data (see
"stick-table" in section 4.2).  A stored data type must be specified
in <type>, and this data type must be stored in the table otherwise an
error is reported. The data is compared according to <operator> with the
64-bit integer <value>.  Operators are the same as with the ACLs :

  - eq : match entries whose data is equal to this value
  - ne : match entries whose data is not equal to this value
  - le : match entries whose data is less than or equal to this value
  - ge : match entries whose data is greater than or equal to this value
  - lt : match entries whose data is less than this value
  - gt : match entries whose data is greater than this value

In this form, you can use multiple data filter entries, up to a maximum
defined during build time (4 by default).

When the key form is used the entry <key> is shown.  The key must be of the
same type as the table, which currently is limited to IPv4, IPv6, integer,
and string.
Example :
    $ echo "show table http_proxy" | socat stdio /tmp/sock1
>>> # table: http_proxy, type: ip, size:204800, used:2
>>> 0x80e6a4c: key=127.0.0.1 use=0 exp=3594729 gpc0=0 conn_rate(30000)=1
      bytes_out_rate(60000)=187
>>> 0x80e6a80: key=127.0.0.2 use=0 exp=3594740 gpc0=1 conn_rate(30000)=10
      bytes_out_rate(60000)=191

    $ echo "show table http_proxy data.gpc0 gt 0" | socat stdio /tmp/sock1
>>> # table: http_proxy, type: ip, size:204800, used:2
>>> 0x80e6a80: key=127.0.0.2 use=0 exp=3594740 gpc0=1 conn_rate(30000)=10
      bytes_out_rate(60000)=191

    $ echo "show table http_proxy data.conn_rate gt 5" |
        socat stdio /tmp/sock1
>>> # table: http_proxy, type: ip, size:204800, used:2
>>> 0x80e6a80: key=127.0.0.2 use=0 exp=3594740 gpc0=1 conn_rate(30000)=10
      bytes_out_rate(60000)=191

    $ echo "show table http_proxy key 127.0.0.2" |
        socat stdio /tmp/sock1
>>> # table: http_proxy, type: ip, size:204800, used:2
>>> 0x80e6a80: key=127.0.0.2 use=0 exp=3594740 gpc0=1 conn_rate(30000)=10
      bytes_out_rate(60000)=191
When the data criterion applies to a dynamic value dependent on time such as
a bytes rate, the value is dynamically computed during the evaluation of the
entry in order to decide whether it has to be dumped or not. This means that
such a filter could match for some time then not match anymore because as
time goes, the average event rate drops.

It is possible to use this to extract lists of IP addresses abusing the
service, in order to monitor them or even blacklist them in a firewall.
Example :
$ echo "show table http_proxy data.gpc0 gt 0"
  | socat stdio /tmp/sock1
  | fgrep 'key=' | cut -d' ' -f2 | cut -d= -f2 > abusers-ip.txt
  ( or | awk '/key/{ print a[split($2,a,"=")]; }' )
When the stick-table is synchronized to a peers section supporting sharding,
the shard number will be displayed for each key (otherwise '0' is reported).
This allows to know which peers will receive this key.
Example:
$ echo "show table http_proxy" | socat stdio /tmp/sock1 | fgrep shard=
  0x7f23b0c822a8: key=10.0.0.2 use=0 exp=296398 shard=9 gpc0=0
  0x7f23a063f948: key=10.0.0.6 use=0 exp=296075 shard=12 gpc0=0
  0x7f23b03920b8: key=10.0.0.8 use=0 exp=296766 shard=1 gpc0=0
  0x7f23a43c09e8: key=10.0.0.12 use=0 exp=295368 shard=8 gpc0=0
Dumps the number of tasks currently in the run queue, with the number of
occurrences for each function, and their average latency when it's known
(for pure tasks with task profiling enabled). The dump is a snapshot of the
instant it's done, and there may be variations depending on what tasks are
left in the queue at the moment it happens, especially in mono-thread mode
as there's less chance that I/Os can refill the queue (unless the queue is
full). This command takes exclusive access to the process and can cause
minor but measurable latencies when issued on a highly loaded process, so
it must not be abused by monitoring bots.
Dumps some internal states and structures for each thread, that may be useful
to help developers understand a problem. The output tries to be readable by
showing one block per thread. When haproxy is built with USE_THREAD_DUMP=1,
an advanced dump mechanism involving thread signals is used so that each
thread can dump its own state in turn. Without this option, the thread
processing the command shows all its details but the other ones are less
detailed. A star ('*') is displayed in front of the thread handling the
command. A right angle bracket ('>') may also be displayed in front of
threads which didn't make any progress since last invocation of this command,
indicating a bug in the code which must absolutely be reported. When this
happens between two threads it usually indicates a deadlock. If a thread is
alone, it's a different bug like a corrupted list. In all cases the process
needs is not fully functional anymore and needs to be restarted.

The output format is purposely not documented so that it can easily evolve as
new needs are identified, without having to maintain any form of backwards
compatibility, and just like with "show activity", the values are meaningless
without the code at hand.
show tls-keys [id|*]
Dump all loaded TLS ticket keys references. The TLS ticket key reference ID
and the file from which the keys have been loaded is shown. Both of those
can be used to update the TLS keys using "set ssl tls-key". If an ID is
specified as parameter, it will dump the tickets, using * it will dump every
keys from every references.
Dump the schema used for the output of "show info json" and "show stat json".

The contains no extra whitespace in order to reduce the volume of output.
For human consumption passing the output through a pretty printer may be
helpful. Example :

$ echo "show schema json" | socat /var/run/haproxy.sock stdio |
  python -m json.tool

The schema follows "JSON Schema" (json-schema.org) and accordingly
verifiers may be used to verify the output of "show info json" and "show
stat json" against the schema.
show trace [<source>]
Show the current trace status. For each source a line is displayed with a
single-character status indicating if the trace is stopped, waiting, or
running. The output sink used by the trace is indicated (or "none" if none
was set), as well as the number of dropped events in this sink, followed by a
brief description of the source. If a source name is specified, a detailed
list of all events supported by the source, and their status for each action
(report, start, pause, stop), indicated by a "+" if they are enabled, or a
"-" otherwise. All these events are independent and an event might trigger
a start without being reported and conversely.
Show the version of the current HAProxy process. This is available from
master and workers CLI.
Example:
$ echo "show version" | socat /var/run/haproxy.sock stdio
2.4.9

$ echo "show version" | socat /var/run/haproxy-master.sock stdio
2.5.0
shutdown frontend <frontend>
Completely delete the specified frontend. All the ports it was bound to will
be released. It will not be possible to enable the frontend anymore after
this operation. This is intended to be used in environments where stopping a
proxy is not even imaginable but a misconfigured proxy must be fixed. That
way it's possible to release the port and bind it into another process to
restore operations. The frontend will not appear at all on the stats page
once it is terminated.

The frontend may be specified either by its name or by its numeric ID,
prefixed with a sharp ('#').

This command is restricted and can only be issued on sockets configured for
level "admin".
shutdown session <id>
Immediately terminate the session matching the specified session identifier.
This identifier is the first field at the beginning of the lines in the dumps
of "show sess" (it corresponds to the session pointer). This can be used to
terminate a long-running session without waiting for a timeout or when an
endless transfer is ongoing. Such terminated sessions are reported with a 'K'
flag in the logs.
shutdown sessions server <backend>/<server>
Immediately terminate all the sessions attached to the specified server. This
can be used to terminate long-running sessions after a server is put into
maintenance mode, for instance. Such terminated sessions are reported with a
'K' flag in the logs.
The "trace" command alone lists the trace sources, their current status, and
their brief descriptions. It is only meant as a menu to enter next levels,
see other "trace" commands below.
Immediately stops all traces. This is made to be used as a quick solution
to terminate a debugging session or as an emergency action to be used in case
complex traces were enabled on multiple sources and impact the service.
trace <source> event [ [+|-|!]<name> ]
Without argument, this will list all the events supported by the designated
source. They are prefixed with a "-" if they are not enabled, or a "+" if
they are enabled. It is important to note that a single trace may be labelled
with multiple events, and as long as any of the enabled events matches one of
the events labelled on the trace, the event will be passed to the trace
subsystem. For example, receiving an HTTP/2 frame of type HEADERS may trigger
a frame event and a stream event since the frame creates a new stream. If
either the frame event or the stream event are enabled for this source, the
frame will be passed to the trace framework.

With an argument, it is possible to toggle the state of each event and
individually enable or disable them. Two special keywords are supported,
"none", which matches no event, and is used to disable all events at once,
and "any" which matches all events, and is used to enable all events at
once. Other events are specific to the event source. It is possible to
enable one event by specifying its name, optionally prefixed with '+' for
better readability. It is possible to disable one event by specifying its
name prefixed by a '-' or a '!'.

One way to completely disable a trace source is to pass "event none", and
this source will instantly be totally ignored.
trace <source> level [<level>]
Without argument, this will list all trace levels for this source, and the
current one will be indicated by a star ('*') prepended in front of it. With
an argument, this will change the trace level to the specified level. Detail
levels are a form of filters that are applied before reporting the events.
These filters are used to selectively include or exclude events depending on
their level of importance. For example a developer might need to know
precisely where in the code an HTTP header was considered invalid while the
end user may not even care about this header's validity at all. There are
currently 5 distinct levels for a trace :

    user         this will report information that are suitable for use by a
                 regular haproxy user who wants to observe his traffic.
                 Typically some HTTP requests and responses will be reported
                 without much detail. Most sources will set this as the
                 default level to ease operations.

    proto        in addition to what is reported at the "user" level, it also
                 displays protocol-level updates. This can for example be the
                 frame types or HTTP headers after decoding.

    state        in addition to what is reported at the "proto" level, it
                 will also display state transitions (or failed transitions)
                 which happen in parsers, so this will show attempts to
                 perform an operation while the "proto" level only shows
                 the final operation.

    data         in addition to what is reported at the "state" level, it
                 will also include data transfers between the various layers.

    developer    it reports everything available, which can include advanced
                 information such as "breaking out of this loop" that are
                 only relevant to a developer trying to understand a bug that
                 only happens once in a while in field. Function names are
                 only reported at this level.

It is highly recommended to always use the "user" level only and switch to
other levels only if instructed to do so by a developer. Also it is a good
idea to first configure the events before switching to higher levels, as it
may save from dumping many lines if no filter is applied.
trace <source> lock [criterion]
Without argument, this will list all the criteria supported by this source
for lock-on processing, and display the current choice by a star ('*') in
front of it. Lock-on means that the source will focus on the first matching
event and only stick to the criterion which triggered this event, and ignore
all other ones until the trace stops. This allows for example to take a trace
on a single connection or on a single stream. The following criteria are
supported by some traces, though not necessarily all, since some of them
might not be available to the source :

    backend      lock on the backend that started the trace
    connection   lock on the connection that started the trace
    frontend     lock on the frontend that started the trace
    listener     lock on the listener that started the trace
    nothing      do not lock on anything
    server       lock on the server that started the trace
    session      lock on the session that started the trace
    thread       lock on the thread that started the trace

In addition to this, each source may provide up to 4 specific criteria such
as internal states or connection IDs. For example in HTTP/2 it is possible
to lock on the H2 stream and ignore other streams once a strace starts.

When a criterion is passed in argument, this one is used instead of the
other ones and any existing tracking is immediately terminated so that it can
restart with the new criterion. The special keyword "nothing" is supported by
all sources to permanently disable tracking.
trace <source> { pause | start | stop } [ [+|-|!]event]
Without argument, this will list the events enabled to automatically pause,
start, or stop a trace for this source. These events are specific to each
trace source. With an argument, this will either enable the event for the
specified action (if optionally prefixed by a '+') or disable it (if
prefixed by a '-' or '!'). The special keyword "now" is not an event and
requests to take the action immediately. The keywords "none" and "any" are
supported just like in "trace event".

The 3 supported actions are respectively "pause", "start" and "stop". The
"pause" action enumerates events which will cause a running trace to stop and
wait for a new start event to restart it. The "start" action enumerates the
events which switch the trace into the waiting mode until one of the start
events appears. And the "stop" action enumerates the events which definitely
stop the trace until it is manually enabled again. In practice it makes sense
to manually start a trace using "start now" without caring about events, and
to stop it using "stop now". In order to capture more subtle event sequences,
setting "start" to a normal event (like receiving an HTTP request) and "stop"
to a very rare event like emitting a certain error, will ensure that the last
captured events will match the desired criteria. And the pause event is
useful to detect the end of a sequence, disable the lock-on and wait for
another opportunity to take a capture. In this case it can make sense to
enable lock-on to spot only one specific criterion (e.g. a stream), and have
"start" set to anything that starts this criterion (e.g. all events which
create a stream), "stop" set to the expected anomaly, and "pause" to anything
that ends that criterion (e.g. any end of stream event). In this case the
trace log will contain complete sequences of perfectly clean series affecting
a single object, until the last sequence containing everything from the
beginning to the anomaly.
trace <source> sink [<sink>]
Without argument, this will list all event sinks available for this source,
and the currently configured one will have a star (‘*’) prepended in front
of it. Sink «none» is always available and means that all events are simply
dropped, though their processing is not ignored (e.g. lock-on does occur).
Other sinks are available depending on configuration and build options, but
typically «stdout» and «stderr» will be usable in debug mode, and in-memory
ring buffers should be available as well. When a name is specified, the sink
instantly changes for the specified source. Events are not changed during a
sink change. In the worst case some may be lost if an invalid sink is used
(or «none»), but operations do continue to a different destination.
trace <source> verbosity [<level>]
Without argument, this will list all verbosity levels for this source, and the
current one will be indicated by a star ('*') prepended in front of it. With
an argument, this will change the verbosity level to the specified one.

Verbosity levels indicate how far the trace decoder should go to provide
detailed information. It depends on the trace source, since some sources will
not even provide a specific decoder. Level "quiet" is always available and
disables any decoding. It can be useful when trying to figure what's
happening before trying to understand the details, since it will have a very
low impact on performance and trace size. When no verbosity levels are
declared by a source, level "default" is available and will cause a decoder
to be called when specified in the traces. It is an opportunistic decoding.
When the source declares some verbosity levels, these ones are listed with
a description of what they correspond to. In this case the trace decoder
provided by the source will be as accurate as possible based on the
information available at the trace point. The first level above "quiet" is
set by default.
update ssl ocsp-response <certfile>
Create an OCSP request for the specified <certfile> and send it to the OCSP
responder whose URI should be specified in the "Authority Information Access"
section of the certificate. Only the first URI is taken into account. The
OCSP response that we should receive in return is then checked and inserted
in the local OCSP response tree. This command will only work for certificates
that already had a stored OCSP response, either because it was provided
during init or if it was previously set through the "set ssl cert" or "set
ssl ocsp-response" commands.
If the received OCSP response is valid and was properly inserted into the
local tree, its contents will be displayed on the standard output. The format
is the same as the one described in "show ssl ocsp-response".
HAProxy is generally the frontend layer of your application, which means it plays a critical role since all traffic first lands on this layer. Because of this, you need to make sure everything is working at this layer all the time, as any issue can directly impact your business. Therefore, having visibility on this layer is crucial.
Visibility can come from two aspects: the metrics HAProxy emits and the logs it generates while handling requests.
In this article, I’ll focus mainly on the logging aspect of HAProxy—how to enable different types of logs and how to work with them to make more informed decisions.
What Are HAProxy Logs?
Haproxy logs are the record of events that indicate what’s happening with HAProxy while starting up, serving a request, and during an error. HAProxy uses log files to record events including requests received by HAProxy, the response to those requests, and their status code. It also logs any errors that occur.
HAProxy emits log messages for processing by a syslog server. These syslog messages are compatible with the basic tools for reading syslog messages like rsyslog. HAProxy syslog messages are also compatible with the systemd-journald service.
You can enable HAProxy log messages by specifying the syslog server, then configuring it for different proxies like frontend and backend. The first step is to enable logging in a global configuration:
global
        log 127.0.0.1:514 local0
HAProxy natively supports syslog logging, which you can enable as shown in the above examples. Syslog facilities and severity levels are also at your disposal, as well as the ability to forward the logs to journald, rsyslog, or any supported syslog server:
log 127.0.0.1:514 facility serverity_level
With the log directive, you can specify the syslog server where you want to send the HAProxy logs. Local0 is one facility used to send logs. Simply add the logging level in the log directive to control what information to log:
log 127.0.0.1:514 local0 info
This will start logging the messages that have the log level of “info” or above. Then, add the log in the default directive, which will enable the same logging in all three frontend, backend, and listen parts.
defaults
        log global
The listen section actually combines the information in the backend section and the frontend section. So instead of defining the backend and frontend separately and mapping them, you can define them in one listen section, and the mapping will be done automatically.
HAProxy has four major sections: global, default, backend, and frontend.
In the global config level, you can define values that work process-wide for security and performance tuning. In the default configs, you have to keep the best configuration, which is used across all/multiple sections depending on your use case. After that, you can override these values in the frontend or backend as required if you want to add another option or override any existing one. You can also have multiple log directives to forward the logs to different files.
Default Logging
In the default section of the configuration, you can mention the default configs that you want to use. This will be used by default in all the sections if not otherwise specified. You can configure things like where to log and the log format, as seen below:
defaults
        log global
        option httplog
        Timeout client 30s
These values will be used automatically in the section’s frontend and backend unless you override these values.
Backend Logging
HAProxy backend servers are the set of servers among which a request is actually load-balanced. Create a logging line separately for these backends using the following configuration:
backend webservers
        balance roundrobin
        server server1
        log 127.0.0.1:514 local0 info
With the above, you’ll be able to easily see the logs of different backends at different syslog servers.
Frontend Logging
Similar to the backend, frontend servers can also have their own logging configuration. The frontend in HAProxy is where traffic actually lands. Based on the frontend configuration, backend servers are chosen and the traffic is forwarded to these. As to logs, these are defined separately as seen in the configuration below:
frontend webui
        bind 0.0.0.0:80
        use_backend webservers
        log 127.0.0.1:514 local0 error
Listen Section Logging
The listen section lets you define all the parts of the proxy together with the frontend and backend. This makes it easy to understand, as you only need to check the listen section for each proxy as described below:
listen fe_main
   log 127.0.0.1:514 local0 error
   # frontend configuration settings
   mode http
   bind :80
   http-request redirect scheme https unless { ssl_fc }

   # backend configuration settings
   balance roundrobin
   option httpchk
   server s1 192.168.1.25:80 check
   server s2 192.168.1.26:8080 check
Logging to a File
Most tools support logging to a file for better accessibility and easier setup. HAProxy, however, doesn’t natively support this. The reason for this design decision is that HAProxy is supposed to proxy requests, not write to the file. HAProxy instead offloads this responsibility to existing solutions like syslog.
If you want to write to a file, you need to configure the syslog server to do so. Below is the config for writing syslog messages to files using the rsyslog service in Linux:
local0.* /var/log/haproxy.log
local0.notice /var/log/hap_notifications.log
Logging in Containerized Environments
By default, containers tend to log to stdout and stderr. HAProxy can easily log to stdout with the configuration below, or you can send the log to syslog server:
global
    log stdout format raw local0
The above config will start logging to stdout. To send the log to the syslog server from the HAProxy container, you can use the following configurations:
global
    log rsyslog_location:514 local0
Read more about this in the documentation on Docker logging with HAProxy.
HAProxy Log Location
HAProxy logs location depends on the operating system you are using:
- On Ubuntu or Debian-based distributions in Linux, the log location is
/var/log/haproxy.log. This is automatically configured by the scripts provided in the installation package. - In CentOS or other Red Hat distributions, HAProxy does not output logs to a file by default, meaning you’ll need to configure it separately. This documentation tells you how to configure logs to a file on CentOS.
HAProxy Log Levels
Similar to other logging agents and tools, HAProxy divides logs into different log levels to make sure they’re properly segregated based on severity and verbosity:
- Emerg: Emergency alerts that can come from underlying operating systems, including errors such as OOM and file descriptor exhaustion
- Alert: Cases that happen rarely and cause unexpected exceptions
- Crit: Not used by HAProxy
- Err: HAProxy configuration errors like unable to parse the configuration file, maps file, etc.
- Warning: Important messages but not critical; errors like failed modification to a request or failed DNS nameserver connection
- Notice: Changes to HAProxy states, e.g., HAProxy emitting a restart, stop, or start event; also for logging module loading and health-check logging
- Info: TCP and HTTP request details and error details
- Debug: Not used by default with HAProxy, but can be used with custom Lua scripts to log extra details
All these log levels are easily configured in the log directives discussed above. It’s important to segregate different HAProxy log levels to facilitate more visibility with less hassle.
HAProxy Log Format
HAProxy can work with TCP and HTTP. It comes with a default log format, or you can customize the log format and use it with whatever field you want.
Default Log Format
The default log format of HAProxy is TCP mode. You can access the information present in TCP mode by logging in as shown in the TCP section below. Default log formats have lots of information present, but there are missing elements like SSL encryption information, headers, and payload. Due to this, users end up creating custom log formats most of the time.
TCP Format
When it’s working with TCP, you can enable it by adding the following configuration:
mode tcp
option tcplog
TCP mode will form a full duplex connection, and you will not be able to look at the application-level details. With TCP, you have to configure the logging mode to TCP so that the log format will comply with the field present in the logging options like byte count, timers, etc.
Fields present in the TCP mode are as below:
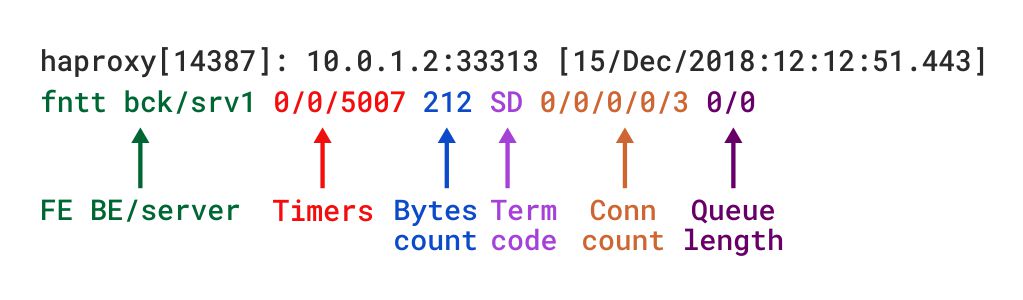
The above details are from the HAProxy official documentation. You can also define the log format in HAProxy using the log-format directive:
log-format "%ci:%cp [%t] %ft %b/%s %Tw/%Tc/%Tt %B %ts
%ac/%fc/%bc/%sc/%rc %sq/%bq"
HTTP Format
When using the HTTP protocol, you have to use the HTTP mode and option as httplog:
mode http
option httplog
In HTTP mode, HAProxy can log more than the TCP details, including log details such as HTTP request URL, status code, bytes sent, request and response header, etc. A full list of details is mentioned in the following:
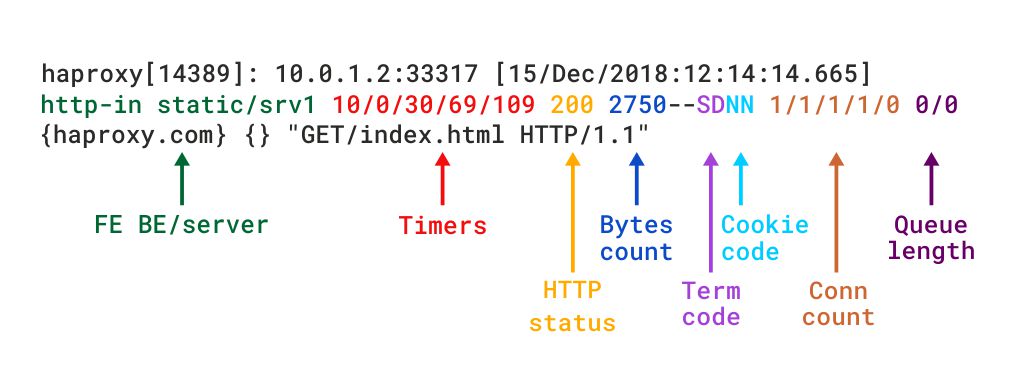
Similar to the TCP logging format, the log-format directive lets you log HTTP requests:
log-format "%ci:%cp [%tr] %ft %b/%s %TR/%Tw/%Tc/%Tr/%Ta %ST %B
%CC %CS %tsc %ac/%fc/%bc/%sc/%rc %sq/%bq %hr %hs %{+Q}r"
The log-format directive can go in the default, frontend, or listen sections. If you put it in the default section, it will consider default options for all the sections.
Custom Log Formatting
The HAProxy logging format has variables to define the logging format properly; below are the rules that all variables have to follow:
- Every variable is preceded by a percentage character “%”.
- Variables can take flags with the help of braces {}.
- Multiple flags can be separated with commas.
- A + or – sign adds or removes flags.
- Spaces that are not between variables have to be escaped with a backslash.
There are three flags:
- Q: To quote a string
- X: For hexadecimal representation
- E: For escapes characters
You can add configuration for headers, SS, etc with the following configurations:
- Connection handshake time (%Th)
- SSL ciphers and versions (%sslc / %sslv)
- Request headers (%hr or %hrl for CLF formatting)
- Response headers (%hs or %hsl for CLF formatting)
- The full HTTP request (%r)
You can look more into these variables and how to use them in HAProxy’s custom logging format documentation.
HAProxy Log Rotation
Like any system, HAProxy can generate large volumes of log data. To limit the amount of disk used by logs, you need to rotate them. Log rotation means keeping the older log data in another format, compressing it, and archiving it at another location.
For log rotation, make use of the logrotate utility in Linux by creating a haproxy.logrotate file with a basic configuration in Linux:
/var/log/haproxy {
    missingok
    notifempty
    sharedscripts
    postrotate
        /bin/kill -HUP `cat /var/run/syslogd.pid 2> /dev/null` 2> /dev/null || true
        /bin/kill -HUP `cat /var/run/rsyslogd.pid 2> /dev/null` 2> /dev/null || true
        /bin/kill -HUP `cat /var/run/syslog-ng.pid 2> /dev/null` 2> /dev/null || true
    endscript
}
How to Read HAProxy Logs
HAProxy has lots of fields and provides great in-depth details about logs, but it can be hard to understand these variables and fields. Fortunately, HAProxy ships with HALog, a very powerful, production-ready log analysis tool. Unfortunately, HALog doesn’t support custom-log format parsing at the moment. But you can use tools like Sematext Logs to solve this problem.
This means it can be deployed in production and is really fast, parsing both TCP and HTTP logs, up to 1-2 GB of logs per second. You can even pass different flags with HALog to make it filter out the information you need.
HALog presents you with metrics that give you critical insight into your servers. It can parse logs to show how many requests failed per server, the total number of requests, the number of occurrences of different status codes, and much more.
These commands will retrieve information including status codes, total requests, and response times:
halog -srv -H < hap.log | column -t
195000 lines in, 10 lines out, 0 parsing errors
#srv_name       1xx  2xx    3xx  4xx  5xx  other  tot_req  req_ok  pct_ok  avg_ct  avg_rt
api/users       0    17969  163  851  0    1      13984    13983   100.0   0       60
api/profile     0    12976  149  854  5    0      13984    13979   100.0   1       150
httpd/<NOSRV>   0    0      8    0    0    0      8        0       0.0     0       0
httpd/users     84   534    0    6    2    0      626      626     100.0   0       342
httpd/profile   72   3096   0    9    10   0      3187     3183    99.9    1       1509
HAProxy Stats Page
HAProxy has a stats page to see all the above details in your web browser; to enable, use the following configuration:
frontend stats
   bind *:8404
   stats enable
   stats uri /stats
   stats refresh 10s
   stats admin if LOCALHOST
This will display the stats page on port 8404:
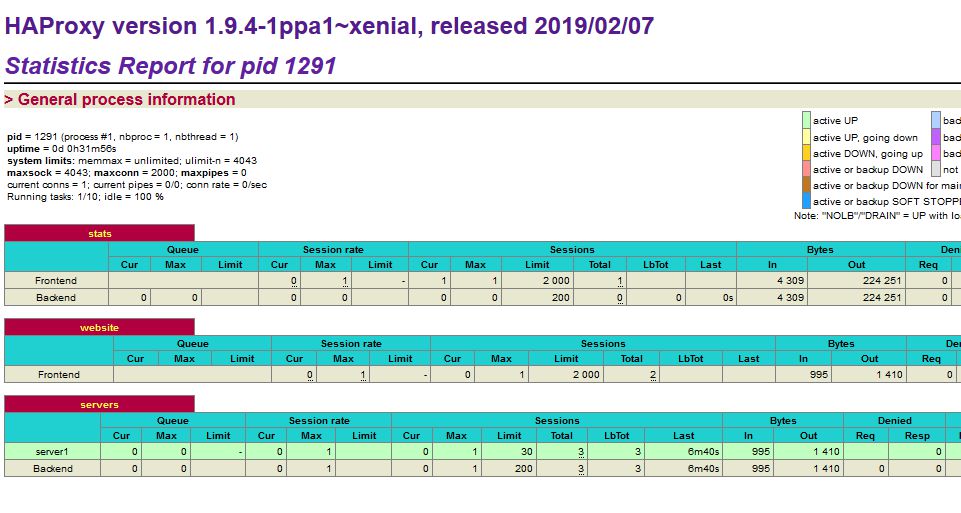
Stats page for HAProxy server. (Source: HAProxy)
Log Monitoring and Analysis with Sematext
Generally, companies run a huge fleet of HAProxy servers to handle traffic; I myself have run some 200 HAProxy servers. These servers generate a huge amount of logs, and looking at them can be a challenge. HALog can help, but it’s still difficult to log into such a huge number of servers, run HALog on each of them, and then accumulate the results.
What you really need is a centralized logging solution such as Sematext Logs, where you can ship all the logs and build analytics on top of it.
Sematext is a log management and monitoring tool with great support for HAProxy logs. It is easy to install and configure. In no time, you’ll be able to see logs in your dashboard and leverage pre-built dashboards to filter out key information.
Sematext comes with many other features that give you confidence in running your HAProxy clusters in production. You can add alerting on the dashboard and forward alerts to different channels such as email, Slack, PagerDuty, and many more.
Sematext Logs is part of the Sematext Cloud, a full-stack observability platform with support for monitoring HAProxy clusters as well as the majority of tools present in your infrastructure. This means that it also gathers HAProxy metrics. Correlating metrics and logs from your HAProxy servers is greatly valuable, reducing the time needed to fix issues in production. Plus, anomaly detection lets you identify issues before they happen based on past metrics.
Watch the video below to learn more about what Sematext Logs can do for you.
Conclusion
HAProxy is a critical component of your infrastructure, and you need visibility on these servers to monitor for errors and performance. You need a centralized location to see logs and receive alerts if you’re running a huge fleet of HAProxy servers.
Sematext provides an effective dashboard to catch issues and alert you in advance via its integration with logging and monitoring solutions around HAProxy.
Sign up for a free trial today.
Author Bio

Gaurav Yadav
Gaurav has been involved with systems and infrastructure for almost 6 years now. He has expertise in designing underlying infrastructure and observability for large-scale software. He has worked on Docker, Kubernetes, Prometheus, Mesos, Marathon, Redis, Chef, and many more infrastructure tools. He is currently working on Kubernetes operators for running and monitoring stateful services on Kubernetes. He also likes to write about and guide people in DevOps and SRE space through his initiatives Learnsteps and Letusdevops.
22 апреля, 2022 11:31 дп
619 views
| Комментариев нет
General, Linux
Для работы над ошибками HAProxy существует три основные команды и стандартный лог. Как правило, при устранении неполадок HAProxy эти команды используются в указанном здесь порядке, после чего просматривается лог файл для получения конкретных диагностических данных.
Итак, в большинстве дистрибутивов Linux команды и лог, которые вы обычно будете использовать для устранения неполадок HAProxy:
- systemctl — используется для управления сервисами Linux и взаимодействия с ними через менеджер сервисов systemd.
- journalctl — используется для запроса и просмотра логов, созданных systemd.
- haproxy — при устранении неполадок эта команда используется для проверки конфигурации HAProxy.
- /var/log/haproxy.log — этот лог-файл содержит записи HAProxy с подробным описанием TCP- и HTTP-трафика, обрабатываемого сервером.
Эти команды, способы их использования и логи HAProxy, в которых можно найти дополнительную информацию об ошибках, более подробно описаны в следующих разделах данного мануала.
Команда systemctl
При устранении распространенных ошибок HAProxy с помощью менеджера systemd первым шагом является проверка состояния процессов HAProxy в вашей системе. Ниже приведена команда systemctl, которая запрашивает у systemd состояние процессов HAProxy в большинстве дистрибутивов Linux.
sudo systemctl status haproxy.service -l --no-pager
Флаг -l отображает выходные данные без сокращений. Флаг –no-pager направляет вывод непосредственно в ваш терминал, не требуя какого-либо вмешательства с вашей стороны для его просмотра. Если вы опустите флаг –no-pager, вы сможете прокручивать вывод с помощью клавиш со стрелками или клавиш pgup и pgdn. Чтобы выйти из режима просмотра, используйте клавишу q.
Вы должны получить такой вывод:
 haproxy.service - HAProxy Load Balancer
   Loaded: loaded (/lib/systemd/system/haproxy.service; enabled; vendor preset: enabled)
   Active: active (running) since Thu 2020-08-20 19:30:11 UTC; 5s ago
     Docs: man:haproxy(1)
           file:/usr/share/doc/haproxy/configuration.txt.gz
  Process: 487 ExecStartPre=/usr/sbin/haproxy -f $CONFIG -c -q $EXTRAOPTS (code=exited, status=0/SUCCESS)
 Main PID: 488 (haproxy)
    Tasks: 2 (limit: 2344)
. . .
Aug 19 21:31:46 d6cdd0c71489 systemd[1]: Started HAProxy Load Balancer.
Ваш вывод может немного отличаться в зависимости от того, какой дистрибутив Linux вы используете. В любом случае в выводе обратите внимание на строку Active. Если ваш сервер HAProxy не определяется как active (running), как выделено в выходных данных в примере, но вы ожидаете, что он должен быть активен, это может указывать на ошибку. Обычно, если проблема есть, в выводе будет такая строка (обратите внимание на failed):
Active: failed (Result: exit-code) since Thu 2020-08-20 19:32:26 UTC; 6s ago
Если вы обнаружили проблему с процессом или конфигурацией HAProxy, вы можете устранить ее с помощью команды journalctl.
Команда journalctl
Чтобы проверить логи systemd для HAProxy, вы можете использовать команду journalctl. Журналы systemd для HAProxy обычно сообщают о проблемах с запуском или управлением процессами HAProxy.
Эти логи ведутся отделено от логов запросов и ошибок HAProxy. journalctl отображает логи из systemd, которые описывают сам сервис HAProxy, от его запуска до завершения работы, а также любые ошибки процесса, которые могут возникнуть на этом пути.
sudo journalctl -u haproxy.service --since today --no-pager
Флаг –since today ограничивает вывод команды записями лога, начиная с 00:00:00 текущего дня. Использование этого параметра поможет сократить объем записей, которые необходимо проверять на наличие ошибок. Вы должны получить примерно следующий вывод (он также может содержать несколько дополнительных строк между строками Starting и Started в зависимости от вашего дистрибутива Linux):
Aug 20 19:37:08 d6cdd0c71489 systemd[1]: Starting HAProxy Load Balancer...
. . .
Aug 20 19:37:08 d6cdd0c71489 systemd[1]: Started HAProxy Load Balancer.
Если в работе сервиса будет обнаружена ошибка, в выводе вы увидите примерно такую строку (основное различие между дистрибутивами Linux заключается в выделенной части yourhostname):
Aug 20 19:32:25 yourhostname systemd[1]: Failed to start HAProxy Load Balancer.
Если сервер HAProxy зарегистрировал ошибки в журналах journalctl, как в предыдущем примере, то следующим шагом в устранении возможных проблем будет исследование конфигурации HAProxy с помощью инструмента командной строки haproxy.
Устранение неполадок с помощью команды haproxy
Чтобы устранить проблемы с конфигурацией HAProxy, используйте команду haproxy -c. Инструмент проанализирует файлы и обнаружит любые ошибки или отсутствующие настройки, прежде чем попытаться снова запустить сервер.
Запустите следующую команду (работает в дистрибутивах Ubuntu, Debian, CentOS и Fedora). Обязательно измените путь к конфигурационному файлу, если вы используете другое имя файла или расположение:
sudo haproxy -c -f /etc/haproxy/haproxy.cfg
Если конфигурация HAProxy не содержит ошибок, вы увидите:
Configuration file is valid
Если в вашей конфигурации HAProxy есть ошибка, например, опечатка или неправильная директива, haproxy -c обнаружит ее и попытается уведомить вас о проблеме.
Допустим, в haproxy.cfg директива bind стоит в неправильном месте. Тогда команда сообщит:
[ALERT] 232/194354 (199) : parsing [/etc/haproxy/haproxy.cfg:13] : unknown keyword 'bind' in 'global' section
[ALERT] 232/194354 (199) : Error(s) found in configuration file : /etc/haproxy/haproxy.cfg
[ALERT] 232/194354 (199) : Fatal errors found in configuration.
В этом примере мы видим, что директива bind неуместна внутри раздела конфигурации global, поэтому HAProxy генерирует ошибку unknown keyword. Сообщение об ошибке также включает номер строки (13), так что вы можете отредактировать файл и исправить или удалить неправильную строку без лишнего поиска.
Умея использовать haproxy -c, вы сможете вовремя обнаружить ошибки, например до перезагрузки HAProxy с отредактированной конфигурацией, которая может содержать опечатки.
Лог-файлы HAProxy
Логи HAProxy — очень полезный ресурс для устранения неполадок. Как правило, любая ошибка, которую вы видите в браузере или другом HTTP-клиенте, будет иметь соответствующую запись в логах HAProxy. Иногда HAProxy также выводит связанные с конфигурацией ошибки и другую отладочную информацию в свои логи.
В дистрибутивах Ubuntu и Debian пакет haproxy включает сценарии, которые настраивают вывод лога в /var/log/haproxy.log.
В CentOS, Fedora и других RedHat-подобных дистрибутивах haproxy по умолчанию не выводит данные в лог. Чтобы регистрировать выходные логи HAProxy в /var/log/haproxy.log, следуйте этому краткому руководству.
Устраняя неполадки HAProxy через лог, проверьте /var/log/haproxy.log на наличие ошибок, используя такой инструмент, как tail или less. Например, чтобы просмотреть последние две строки лога с помощью tail, выполните следующую команду:
sudo tail -n 2 /var/log/haproxy.log
Допустим, что в логе есть запись об ошибке. Она будет выглядеть примерно так, независимо от того, какой дистрибутив Linux вы используете для запуска своего сервера HAProxy:
Aug 20 19:36:21 d6cdd0c71489 haproxy[19202]: [ALERT] 258/134605 (19202) : Proxy 'app', server 'app1' [/etc/haproxy/haproxy.cfg:88] verify is enabled by default but no CA file specified. If you're running on a LAN where you're certain to trust the server's certificate, please set an explicit 'verify none' statement on the 'server' line, or use 'ssl-server-verify none' in the global section to disable server-side verifications by default.
Aug 20 19:36:22 d6cdd0c71489 haproxy[4451]: 203.0.113.1:54428 [20/Aug/2020:19:36:22.288] main app/<NOSRV> 0/-1/-1/-1/1 503 212 - - SC-- 1/1/0/0/0 0/0 "GET / HTTP/1.1"
Не забывайте, что это всего лишь пример. Если вы диагностируете ошибки на своем сервере HAProxy, скорее всего, строки в ваших логах будут содержать другую информацию. Кроме того, некоторые строки содержат ответы об успешных операциях и другие некритические диагностические записи.
Независимо от вашего дистрибутива Linux формат строк в логах HAProxy содержит все коды состояния HTTP, которые возвращаются клиентам, а также все запрашиваемые IP-адреса и состояние внутренних серверов.
Как только у вас появится представление о том, что может вызывать проблемы с сервером HAProxy, вы можете продолжить исследование своей среды и устранить проблему. Особенно полезны коды состояния HTTP и текстовое описание, так как они содержат явные и конкретные термины, которые можно использовать для сужения диапазона при поиске возможных причин проблемы.
Заключение
Процесс устранения ошибок HAProxy может включать в себя диагностику ошибок самого сервера, поиск неправильно настроенных параметров, подробное исследование правил управления доступом и многое другое. В этом кратком мануале по диагностике проблем HAProxy вы узнали, как использовать ряд утилит, помогающих сузить круг возможных причин ошибок. Обычно эти утилиты используются в одном и том же порядке, хотя вы всегда можете пропустить некоторые из них или начать непосредственно с изучения логов, если у вас есть общее представление о том, в чем может быть проблема.
Однако в общем при устранении неполадок рекомендуется соблюдать методичность и последовательность и использовать эти инструменты в описанном порядке. Начните устранение неполадок с помощью systemctl, чтобы проверить состояние сервера HAProxy. Если вам нужна дополнительная информация, изучите логи systemd для HAProxy с помощью команды journalctl. Если после проверки journalctl проблему по-прежнему не удалось обнаружить, следующим шагом будет тестирование конфигурации HAProxy с помощью haproxy -c -f /etc/haproxy/haproxy.cfg. Наконец, для углубленного устранения неполадок необходимо изучить логи HAProxy, где обычно можно найти информацию о конкретной ошибке с полезными диагностическими сообщениями и кодами.
В последующих руководствах этой серии мы подробно рассмотрим некоторые распространенные ошибки, с которыми вы можете столкнуться при использовании HAProxy.
Tags: HAProxy, journalctl
И снова здравствуйте!
В прошлый раз мы рассказывали о выборе инструмента в Ostrovok.ru для решения задачи проксирования большого количества запросов к внешним сервисам, никого при этом не положив. Статья закончилась выбором Haproxy. Сегодня я поделюсь нюансами, с которыми мне пришлось столкнуться при использовании этого решения.

Конфигурация Haproxy
Первая сложность заключалась в том, что опция maxconn у Haproxy бывает разной в зависимости от контекста:
- maxconn (performance tuning);
- maxconn (bind options);
- maxconn (server and default-server options).
По привычке я настроил только первый вариант (performance tuning). Вот что говорит об этой опции документация:
Sets the maximum per-process number of concurrent connections to <number>. It
is equivalent to the command-line argument «-n». Proxies will stop accepting
connections when this limit is reached.
Казалось бы – то, что нужно. Однако, когда я наткнулся на то, что новые соединения к прокси проходят не сразу, то стал более внимательно читать документацию, и там уже нашел второй параметр (bind options):
Limits the sockets to this number of concurrent connections. Extraneous
connections will remain in the system’s backlog until a connection is
released. If unspecified, the limit will be the same as the frontend’s maxconn.
Так-с, идем, значит, искать frontends maxconn:
Fix the maximum number of concurrent connections on a frontend
…
By default, this value is set to 2000.
Отлично, то, что нужно. Добавляем в конфигурацию:
global
  daemon
  maxconn 524288

...

defaults
  mode http
  maxconn 524288
Следующий затык был в том, что Haproxy однопоточен. Я очень привык к модели в Nginx, поэтому этот нюанс меня всегда удручал. Но отчаиваться не стоит – Вилли (Willy Tarreau – разработчик Haproxy) понимал, что делал, поэтому добавил опцию – nbproc.
Однако прямо в документации сказано:
USING MULTIPLE PROCESSES
IS HARDER TO DEBUG AND IS REALLY DISCOURAGED.
Эта опция действительно может принести головную боль в случаях, если вам нужно:
- ограничивать количество запросов/соединений к серверам (так как у вас уже будет не один процесс с одним счетчиком, а много процессов, и у каждого счетчик свой);
- собирать статистику из сокета управления Haproxy;
- включать/отключать бэкенды через управляющий сокет;
- … возможно что-то еще. ¯_(ツ)_/¯
Тем не менее боги даровали нам многоядерные процессоры, поэтому хотелось бы их использовать по максимуму. В моем случае было по четыре ядра в двух физических ядрах. Для Haproxy я выделил первое ядро, и выглядело это следующим образом:
  nbproc 4
  cpu-map 1 0
  cpu-map 2 1
  cpu-map 3 2
  cpu-map 4 3
С помощью cpu-map мы привязываем процессы Haproxy к определенному ядру. Планировщику OS больше не нужно думать, где бы запланировать работу Haproxy, тем самым сохраняя content switch в холоде, а cpu кэш – в тепле.
Буферов бывает много, но не в нашем случае
- tune.bufsize – в нашем случае бустить его не пришлось, но если у вас бывают ошибки с кодом
400 (Bad Request), то, возможно, это ваш случай. - tune.http.cookielen – если раздаете пользователям большие «печеньки», то, во избежание их повреждения во время передачи по сети, может иметь смысл поднять и этот буфер.
- tune.http.maxhdr – еще один возможный источник 400-х кодов ответов в случае, если у вас передается очень много заголовков.
Теперь рассмотрим более низкоуровневые штуки
tune.rcvbuf.client / tune.rcvbuf.server, tune.sndbuf.client / tune.sndbuf.server – в документации сказано следующее:
It should normally never be set, and the default size (0) lets the kernel autotune this value depending on the amount of available memory.
Но для меня явное лучше неявного, поэтому я зафорсил значения этих опций, чтобы быть уверенным в завтрашнем дне.
И еще один параметр, не относящийся к буферам, но достаточно важный – tune.maxaccept.
Sets the maximum number of consecutive connections a process may accept in a
row before switching to other work. In single process mode, higher numbers
give better performance at high connection rates. However in multi-process
modes, keeping a bit of fairness between processes generally is better to
increase performance.
В нашем случае генерируется довольно много запросов к прокси, поэтому я поднял это значение, чтобы за раз принимать больше запросов. Тем не менее, как и говорится в документации, стоит потестировать, чтобы в многопоточном режиме нагрузка была максимально равномерно распределена между процессами.
Все параметры вместе:
  tune.bufsize 16384
  tune.http.cookielen 63
  tune.http.maxhdr 101
  tune.maxaccept 256

  tune.rcvbuf.client 33554432
  tune.rcvbuf.server 33554432

  tune.sndbuf.client 33554432
  tune.sndbuf.server 33554432
Чего много не бывает, так это таймаутов. Что бы мы без них делали?
- timeout connect – время на установление соединения с бэкендом. Если связь с бэкендом не очень, то лучше отключить его по этому таймауту, пока сеть не придет в норму.
- timeout client – таймаут на передачу первых байт данных. Хорошо помогает отключать тех, кто делает запросы “про запас”.
Кулстори про HTTP клиент в Go
В Go есть штатный HTTP клиент, у которого есть возможность держать пул соединений к серверам. Так случилась одна интересная история, в которой принял участие вышеописанный таймаут и пул соединений в HTTP клиенте. Однажды разработчик пожаловался, что у него периодически бывают 408 ошибки от прокси. Мы заглянули в код клиента и увидели там такую логику:
- пытаемся из пула взять свободное установленное соединение;
- если не вышло, запускаем в горутине установку нового соединения;
- проверяем пул еще раз;
- если в пуле нашлось свободное — берем его, а новое складываем в пул, если нет — используем новое.
Уже поняли, в чем соль?
Если клиент установил новое соединение, но не воспользовался им, то спустя пять секунд сервер его закрывает, и дело с концом. Клиент же отлавливает это только тогда, когда уже достает соединение из пула и пытается им воспользоваться. Стоит иметь это ввиду.
- timeout server – максимальное время ожидания ответа от сервера.
- timeout client-fin/timeout server-fin – здесь мы защищаемся от полузакрытых соединений, чтобы не копить их в таблице операционной системы.
- timeout http-request – один из самых годных таймаутов. Позволяет отрубать медленных клиентов, которые не могут оформить HTTP запрос в отведенное для них время.
- timeout http-keep-alive – конкретно в нашем случае, если
keep-aliveсоединение висит без запросов больше 50 секунд, то, скорее всего, что-то пошло не так, и соединение можно прикрыть, освободив тем самым память для чего-то нового, светлого.
Все таймауты вместе:
defaults
  mode http
  maxconn 524288

  timeout connect 5s
  timeout client 10s
  timeout server 120s

  timeout client-fin 1s
  timeout server-fin 1s

  timeout http-request 10s
  timeout http-keep-alive 50s
Логирование. Почему так сложно?
Как я уже писал раньше, чаще всего в своих решениях я использую Nginx, поэтому избалован его синтаксисом и простотой модификации форматов логов. Особенно мне нравилась киллер фича – форматировать логи в виде json, чтобы потом парсить их любой стандартной библиотекой.
Что же у нас есть в Haproxy? Такая возможность тоже есть, только писать можно исключительно в syslog, и синтаксис конфигурации чуть более завернутый.
Сразу приведу пример конфигурации с комментариями:
# выносим все, что касается ошибок или событий, в отдельный лог (по аналогии с
# error.log в nginx)
log 127.0.0.1:2514 len 8192 local1 notice emerg

# здесь у нас что-то вроде access.log
log 127.0.0.1:2514 len 8192 local7 info
Особую боль доставляют такие моменты:
- короткие имена переменных, а особенно их комбинации вроде %HU или %fp
- формат нельзя разбивать на несколько строк, поэтому приходится писать портянку в одну строку. трудно добавлять/удалять новые/не нужные элементы
- чтобы некоторые переменные заработали, их нужно явно объявлять через capture request header
В итоге, чтобы получить что-то интересное, приходится иметь вот такую портянку:
log-format '{"status":"%ST","bytes_read":"%B","bytes_uploaded":"%U","hostname":"%H","method":"%HM","request_uri":"%HU","handshake_time":"%Th","request_idle_time":"%Ti","request_time":"%TR","response_time":"%Tr","timestamp":"%Ts","client_ip":"%ci","client_port":"%cp","frontend_port":"%fp","http_request":"%r","ssl_ciphers":"%sslc","ssl_version":"%sslv","date_time":"%t","http_host":"%[capture.req.hdr(0)]","http_referer":"%[capture.req.hdr(1)]","http_user_agent":"%[capture.req.hdr(2)]"}'
Ну и, казалось бы, мелочи, но приятные
Выше я описывал формат лога, но не все так просто. Чтобы залогировать некоторые элементы в нем, такие как:
- http_host,
- http_referer,
- http_user_agent,
нужно сперва захватить эти данные из запроса (capture) и поместить в массив захваченных значений.
Вот пример:
capture request header Host len 32
capture request header Referer len 128
capture request header User-Agent len 128
В результате мы теперь можем обращаться к нужным для нас элементам таким образом:
%[capture.req.hdr(N)], где N – порядковый номер определения capture группы.
В вышеприведенном примере заголовок Host будет под номером 0, а User-Agent – под номером 2.
У Haproxy есть особенность: он резолвит DNS адреса бэкендов при запуске и, если не может разрезолвить какой-то из адресов, падает смертью храбрых.
В нашем случае это не очень удобно, так как бэкендов много, мы ими не управляем, и лучше получить 503 от Haproxy, чем весь прокси-сервер откажется стартовать из-за одного поставщика. Помогает нам в этом следующая опция: init-addr.
Строка, взятая прямиком из документации, позволяет нам пройтись по всем доступным методам резолва адреса и, в случае фейла, просто отложить это дело на потом и пойти дальше:
default-server init-addr last,libc,none
Ну и напоследок – мое любимое: выбор бэкенда.
Синтаксис конфигурации выбора бэкенда у Haproxy всем знаком:
use_backend <backend1_name> if <condition1>
use_backend <backend2_name> if <condition2>

default-backend <backend3>
Но, право слово, это как-то не очень. У меня уже описаны все бэкенды автоматизированным путем (см. предыдущую статью), можно было бы и здесь генерировать use_backend, дурное дело — не хитрое, но не захотелось. В итоге нашелся другой путь:
  capture request header Host len 32
  capture request header Referer len 128
  capture request header User-Agent len 128

  # выставляем переменную host_present если запрос пришел с заголовком Host
  acl host_present hdr(host) -m len gt 0

  # вырезаем из заголовка префикс, который идентичен имени бэкенда
  use_backend %[req.hdr(host),lower,field(1,'.')] if host_present

  # а если с заголовками не срослось, то отдаем ошибку
  default_backend default

backend default
  mode http
  server no_server 127.0.0.1:65535
Таким образом, мы стандартизировали имена бэкендов и урлы, по которым к ним можно сходить.
Ну а теперь компиляция из вышеприведенных примеров в один файл:
Полная версия конфигурации
  global
    daemon
    maxconn 524288
    nbproc 4
    cpu-map 1 0
    cpu-map 2 1
    cpu-map 3 2
    cpu-map 4 3

    tune.bufsize 16384
    tune.comp.maxlevel 1
    tune.http.cookielen 63
    tune.http.maxhdr 101
    tune.maxaccept 256

    tune.rcvbuf.client 33554432
    tune.rcvbuf.server 33554432

    tune.sndbuf.client 33554432
    tune.sndbuf.server 33554432

    stats socket /run/haproxy.sock mode 600 level admin
    log /dev/stdout local0 debug


  defaults
    mode http
    maxconn 524288

    timeout connect 5s
    timeout client 10s
    timeout server 120s

    timeout client-fin 1s
    timeout server-fin 1s

    timeout http-request 10s
    timeout http-keep-alive 50s

    default-server init-addr last,libc,none

    log 127.0.0.1:2514 len 8192 local1 notice emerg
    log 127.0.0.1:2514 len 8192 local7 info
    log-format '{"status":"%ST","bytes_read":"%B","bytes_uploaded":"%U","hostname":"%H","method":"%HM","request_uri":"%HU","handshake_time":"%Th","request_idle_time":"%Ti","request_time":"%TR","response_time":"%Tr","timestamp":"%Ts","client_ip":"%ci","client_port":"%cp","frontend_port":"%fp","http_request":"%r","ssl_ciphers":"%sslc","ssl_version":"%sslv","date_time":"%t","http_host":"%[capture.req.hdr(0)]","http_referer":"%[capture.req.hdr(1)]","http_user_agent":"%[capture.req.hdr(2)]"}'


  frontend http
    bind *:80

    http-request del-header X-Forwarded-For
    http-request del-header X-Forwarded-Port
    http-request del-header X-Forwarded-Proto

    capture request header Host len 32
    capture request header Referer len 128
    capture request header User-Agent len 128

    acl host_present hdr(host) -m len gt 0
    use_backend %[req.hdr(host),lower,field(1,'.')] if host_present

    default_backend default


  backend default
    mode http
    server no_server 127.0.0.1:65535

  resolvers dns
    hold valid 1s
    timeout retry 100ms
    nameserver dns1 127.0.0.1:53
Спасибо тем, кто дочитал до конца. Тем не менее это еще не все. В следующий раз рассмотрим уже более низкоуровневые штуки, касающиеся оптимизации самой системы, в которой трудится Haproxy, чтобы ему и нашей операционной системе было комфортно вместе, и железа хватало на всех.
До встречи!
Contents
- 1 Internal
- 2 Overview
- 3 TODO
- 4 Example
- 5 Dependency on Other Services
- 6 Logging Configuration
- 6.1 Logging Destination Configuration
- 6.1.1 Configure HAProxy to Log into a File
- 6.2 Log Format
- 6.1 Logging Destination Configuration
- 7 SSL Configuration
- 8 Subjects
- 9 Configuration Reference
- 9.1 Options
- 9.1.1 httplog
- 9.1.2 tcplog
- 9.1.3 ssl-hello-chk
- 9.2 global
- 9.3 defaults
- 9.3.1 mode
- 9.3.1.1 http
- 9.3.1.2 tcp
- 9.3.2 balance
- 9.3.2.1 roundrobin
- 9.3.2.2 source
- 9.3.2.3 static-rr
- 9.3.2.4 leastconn
- 9.3.2.5 first
- 9.3.2.6 uri
- 9.3.2.7 url_param
- 9.3.2.8 hdr(name)
- 9.3.2.9 rdp-cookie, rdp-cookie(name)
- 9.3.1 mode
- 9.4 listen
- 9.5 frontend
- 9.5.1 bind
- 9.6 backend
- 9.1 Options
Internal
- HAProxy
Overview
If installed with yum, the default configuration file is deployed in /etc/haproxy/haproxy.cfg and the systemd configuration file in /etc/sysconfig/haproxy.
HAProxy’s configuration process involves 3 sources of configuration parameters:
- Arguments from the command line, which always take precedence over file configuration.
- The global section, which sets process-wide parameters.
- The proxies sections, which are defaults, listen, frontend and backend.
TODO
HAProxy and OpenShift: HAProxy on lb.local. It seems that if none of the masters are not available when HAProxy starts, it fails and then it does not retry. How to I configure it to retry for each request? Maybe Ansible knows how to do that?
Example
The following example proxies HTTPS connections by passing them directly to the backend.
#---------------------------------------------------------------------
# Global settings
#---------------------------------------------------------------------
global
    maxconn     20000
    log         127.0.0.1:514 local2
    chroot      /var/lib/haproxy
    pidfile     /var/run/haproxy.pid
    user        haproxy
    group       haproxy
    daemon

    # turn on stats unix socket
    stats socket /var/lib/haproxy/stats

#---------------------------------------------------------------------
# common defaults that all the 'listen' and 'backend' sections will
# use if not designated in their block
#---------------------------------------------------------------------
defaults
    mode                    http
    log                     global
    option                  httplog
    option                  dontlognull
#    option http-server-close
#    option forwardfor       except 127.0.0.0/8
    option                  redispatch
    retries                 3
    timeout http-request    10s
    timeout queue           1m
    timeout connect         10s
    timeout client          300s
    timeout server          300s
    timeout http-keep-alive 10s
    timeout check           10s
    maxconn                 20000

listen stats :9000
    mode http
    stats enable
    stats uri /

frontend  atomic-openshift-api
    bind *:443
    mode tcp
    option tcplog
    default_backend atomic-openshift-api

backend atomic-openshift-api
    mode tcp
    balance source
    server      master1 192.168.122.13:443 check
    server      master2 192.168.122.14:443 check
    server      master3 192.168.122.15:443 check
Dependency on Other Services
Under some circumstances, HAProxy need other services to start before it starts, so it can rely on them. For example, if a local DNS server resolves the names referred from HAProxy configuration file, the named service must start before HAProxy. This is configured in the HAProxy’s unit file /usr/lib/systemd/system/haproxy.service:
Requires=named.service
After=syslog.target network.target named.service
More details: Declaring a Dependency on a Service.
Logging Configuration
Logging Destination Configuration
HAProxy logging concepts:
- HAProxy Concepts — Logging
Logging configuration consists of the following steps:
Add the following to the «global» section of the configuration file:
log 127.0.0.1:514 local2
and then add the following to each «defaults» section or to each frontend and backend section:
log global
Then make sure the local syslogd does listen to the UDP traffic. For details on how to do this for rsyslogd, see:
- Enable rsyslogd to Listen for UDP Traffic
Configure HAProxy to Log into a File
Assuming that logging was configured as described in the previous section, configure local2 events to go to the /var/log/haproxy.log file. Add the following line in /etc/rsyslog.conf:
local2.* /var/log/haproxy.log
Log Format
HAProxy comes with two pre-defined log formats:
1. HTTP log format:
%ci:%cp [%tr] %ft %b/%s %TR/%Tw/%Tc/%Tr/%Ta %ST %B %CC %CS %tsc %ac/%fc/%bc/%sc/%rc %sq/%bq %hr %hs %{+Q}r
2. TCP log format:
%ci:%cp [%t] %ft %b/%s %Tw/%Tc/%Tt %B %ts %ac/%fc/%bc/%sc/%rc %sq/%bq
These can be requested in the corresponding section («listen», «fronted», etc.) with the following declaration:
...
frontend
  ...
  option tcplog|httplog
The log format can be customized, by declaring it in «defaults» section or in the appropriate «listen» or «frontend»
log-format %Ci:%Cp [%t] %ft %b/%s %Tw/%Tc/%Tt %B %ts %ac/%fc/%bc/%sc/%rc %sq/%bq
Important: When declaring a custom log format, spaces must be escaped (‘ ‘), because log-format expects just one argument.
Also important: When using a custom log format, options «tcplog» or «httplog» in the «defaults» or «frontend» sections must be commented out, otherwise they take precedence and the custom format does not surface.
SSL Configuration
- HAProxy SSL Pass-Through Configuration
- HTTP/HTTPS HAProxy Configuration Example — OpenShift 3.6 Installation
Subjects
- HAProxy Routing Among Two Classes of Backends Based on Request Structure
Configuration Reference
Options
httplog
tcplog
Logging is set to tcp instead of the default http.
ssl-hello-chk
A health check that verifies the the connection and its ability to handle SSL (SSLv3 specifically) connections.
global
The «global» section sets process-wide parameters.
defaults
This is one of four «proxy» sections (defaults, listen, frontend, backend). It sets default parameters for all other sections following its declaration. These default parameters are overwritten by the subsequent «defaults» sections, if present.
mode
Possible values:
http
tcp
Used to pass secure connections off to a backend server without encrypting it.
balance
- http://cbonte.github.io/haproxy-dconv/1.8/configuration.html#4-balance
Specifies the algorithm used to select a server when doing load balancing. This only applies when no persistence information is available, or when a connection is redispatched to another server. Possible values:
roundrobin
Each server is used in turns, according to their weights. This is the smoothest and fairest algorithm when the server’s processing time remains equally distributed. This algorithm is dynamic, which means that server weights may be adjusted on the fly for slow starts for instance. It is limited by design to 4095 active servers per backend.
source
The source IP address is hashed and divided by the total weight of the running servers to designate which server will receive the request. This ensures that the same client IP address will always reach the same server as long as no server goes down or up. If the hash result changes due to the number of running servers changing, many clients will be directed to a different server. This algorithm is generally used in TCP mode where no cookie may be inserted. It may also be used on the Internet to provide a best-effort stickiness to clients which refuse session cookies. This algorithm is static by default, which means that changing a server’s weight on the fly will have no effect, but this can be changed using «hash-type».
static-rr
leastconn
first
uri
url_param
hdr(name)
rdp-cookie, rdp-cookie(name)
listen
This is one of four «proxy» sections (defaults, listen, frontend, backend). It defines a complete proxy with its fronted and backend parts combined in one section. It is generally useful for TCP-only traffic.
frontend
This is one of four «proxy» sections (defaults, listen, frontend, backend). It describes a set of listening sockets accepting client connections.
bind
- http://cbonte.github.io/haproxy-dconv/1.8/configuration.html#4-bind
frontend frontend-1
    bind 1.2.3.4:80,1.2.3.4:443
backend
This is one of four «proxy» sections (defaults, listen, frontend, backend). It describes a set of servers to which the proxy will connect to forward incoming connections.